Cisco 2006 Annual Report Download - page 33
Download and view the complete annual report
Please find page 33 of the 2006 Cisco annual report below. You can navigate through the pages in the report by either clicking on the pages listed below, or by using the keyword search tool below to find specific information within the annual report.-
 1
1 -
2
-
3
-
4
-
5
-
6
-
7
-
8
-
9
-
10
-
11
-
12
-
13
-
14
-
15
-
16
-
17
-
18
-
19
-
20
-
21
-
22
-
 23
23 -
 24
24 -
 25
25 -
 26
26 -
 27
27 -
 28
28 -
 29
29 -
 30
30 -
 31
31 -
 32
32 -
 33
33 -
 34
34 -
 35
35 -
 36
36 -
 37
37 -
 38
38 -
 39
39 -
 40
40 -
 41
41 -
 42
42 -
 43
43 -
44
-
45
-
46
-
47
-
48
-
49
-
50
-
51
-
52
-
53
-
54
-
55
-
56
-
57
-
58
-
59
-
60
-
61
-
62
-
63
-
64
-
65
-
66
-
67
-
68
-
69
-
70
-
71
-
72
-
73
-
74
-
75
-
76
-
77
-
78
-
79
 |
 |

36 Cisco Systems, Inc.
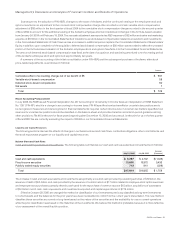
As of July 29, 2006, approximately $6 billion of our cash and cash equivalents and investments was held in the United States. The
remainder of our cash and cash equivalents and investments was held outside of the United States in various foreign subsidiaries. If these
cash and cash equivalents and investments were distributed to the United States in the form of dividends or otherwise, we would be
subject to additional U.S. income taxes (subject to an adjustment for foreign tax credits) and foreign withholding taxes.
We expect that cash provided by operating activities may uctuate in future periods as a result of a number of factors, including
uctuations in our operating results, shipment linearity, accounts receivable collections, inventory management, excess tax benets from
stock-based compensation, and the timing and amount of tax and other payments. Shipment linearity is a measure of the level of shipments
throughout a particular quarter. For additional discussion, see Part I, Item 1A. Risk Factors in our Annual Report on Form 10-K.
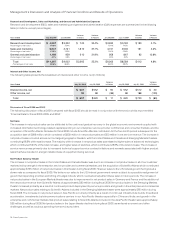
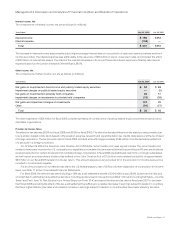
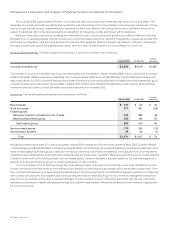
Accounts Receivable, Net The following table summarizes our accounts receivable, net (in millions):
July 30, 2005
Increase
(Decrease)July 29, 2006
Accounts receivable, net $ 3,303 $ 2,216 $ 1,087
The increase in accounts receivable was due to increased sales and the addition of approximately $240 million of accounts receivable
related to Scientic-Atlanta. Days sales outstanding in accounts receivable (DSO) as of July 29, 2006 and July 30, 2005 was 38 days and 31
days, respectively. Our DSO is primarily impacted by shipment linearity and collections performance. A steady level of shipments and good
collections performance will result in reduced DSO compared with a higher level of shipments toward the end of a quarter, which will result
in a shorter amount of time to collect the related accounts receivable and increased DSO.
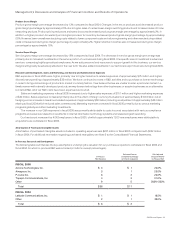
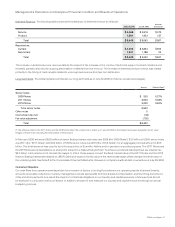
Inventories The following table summarizes our inventories (in millions):
July 30, 2005
Increase
(Decrease)July 29, 2006
Raw materials $ 131 $ 82 $ 49
Work in process 377 431 (54)
Finished goods:
Distributor inventory and deferred cost of sales 423 385 38
Manufacturing finished goods 236 184 52
Total finished goods 659 569 90
Service-related spares 170 180 (10)
Demonstration systems 34 35 (1)
Total $ 1,371 $ 1,297 $ 74
Annualized inventory turns were 8.5 in the fourth quarter of scal 2006 compared to 6.6 in the fourth quarter of scal 2005. Scientic-Atlanta
contributed approximately $150 million of inventory at July 29, 2006. Our nished goods consist of distributor inventory and deferred cost of
sales and manufacturing nished goods. Distributor inventory and deferred cost of sales are related to unrecognized revenue on shipments
to distributors and retail partners and shipments to enterprise and service provider customers. Manufacturing nished goods consist primarily
of build-to-order and build-to-stock products. Service-related spares consist of reusable equipment related to our technical support and
warranty activities. All inventories are accounted for at the lower of cost or market.
In the third quarter of scal 2006, we began the initial implementation of the lean manufacturing model. Lean manufacturing is an
industry-standard model that seeks to drive efciency and exibility in manufacturing processes and in the broader supply chain. Over
time, consistent with what we have experienced thus far, we expect this process will result in incremental increases in purchase commitments
with contract manufacturers and suppliers and corresponding decreases in manufacturing inventory. Inventory management remains an
area of focus as we balance the need to maintain strategic inventory levels to ensure competitive lead times with the risk of inventory
obsolescence because of rapidly changing technology and customer requirements. We believe the amount of our inventory is appropriate
for our revenue levels.
Management’s Discussion and Analysis of Financial Condition and Results of Operations