Cisco 2006 Annual Report Download - page 64
Download and view the complete annual report
Please find page 64 of the 2006 Cisco annual report below. You can navigate through the pages in the report by either clicking on the pages listed below, or by using the keyword search tool below to find specific information within the annual report.-
 1
1 -
2
-
3
-
4
-
5
-
6
-
7
-
8
-
9
-
10
-
11
-
12
-
13
-
14
-
15
-
16
-
17
-
18
-
19
-
20
-
21
-
22
-
23
-
24
-
25
-
26
-
27
-
28
-
29
-
30
-
31
-
32
-
33
-
34
-
35
-
36
-
37
-
38
-
39
-
40
-
41
-
42
-
43
-
44
-
45
-
46
-
47
-
48
-
49
-
50
-
51
-
52
-
53
-
 54
54 -
 55
55 -
 56
56 -
 57
57 -
 58
58 -
 59
59 -
 60
60 -
 61
61 -
 62
62 -
 63
63 -
 64
64 -
 65
65 -
 66
66 -
 67
67 -
 68
68 -
 69
69 -
 70
70 -
 71
71 -
 72
72 -
 73
73 -
 74
74 -
75
-
76
-
77
-
78
-
79
 |
 |

2006 Annual Report 67
In 1997, the Company adopted the Supplemental Plan, under which stock options can be granted or shares can be directly issued to
eligible employees. Ofcers and members of the Company’s Board of Directors are not eligible to participate in the Supplemental Plan.
Nine million shares have been reserved for issuance under the Supplemental Plan. All stock option grants have an exercise price equal to
the fair market value of the underlying stock on the grant date. The Company no longer makes stock option grants or direct share issuances
under the Supplemental Plan.
Effective upon completion of the Company’s acquisition of Scientic-Atlanta, the Company adopted the Acquisition Plan. The Acquisition
Plan constitutes an assumption, amendment, restatement and renaming of the 2003 Long-Term Incentive Plan of Scientic-Atlanta. The
Acquisition Plan permits the grant of stock options, stock grants, stock units and stock appreciation rights to certain employees of the
Company and its subsidiaries and afliates who had been employed by Scientic-Atlanta or its subsidiaries. An aggregate of 14.8 million
shares of the Company’s common stock has been reserved for issuance under the Acquisition Plan on a discretionary basis, subject to
limitations set forth in the Acquisition Plan.
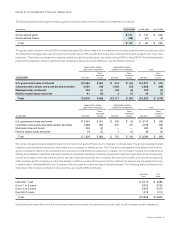
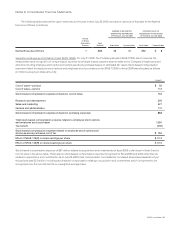
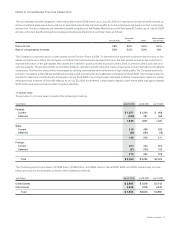
Distribution and Dilutive Effect of Stock Options The following table illustrates the grant dilution and exercise dilution (in millions,
except percentages):
Years Ended July 29, 2006 July 30, 2005
Shares of common stock outstanding 6,059 6,331
Granted and assumed 230 244
Canceled/forfeited/expired (84) (65)
Net stock options granted 146 179
Grant dilution(1) 2.4% 2.8%
Exercised 136 93
Exercise dilution(2) 2.2% 1.5%
(1) The percentage for grant dilution is computed based on net stock options granted as a percentage of shares of common stock outstanding at the scal year end.
(2) The percentage for exercise dilution is computed based on stock options exercised as a percentage of shares of common stock outstanding at the scal year end.
Weighted-average basic and diluted shares outstanding for the year ended July 29, 2006 were 6.2 billion shares and 6.3 billion shares,
respectively. Diluted shares outstanding include the dilutive effect of in-the-money options, which is calculated based on the average share
price for each scal year using the treasury stock method. Under the treasury stock method, the amount that the employee must pay for
exercising stock options, the amount of compensation cost for future service that the Company has not yet recognized, and the amount of
tax benets that would be recorded in additional paid-in capital when the award becomes deductible are assumed to be used to repurchase
shares. In scal 2006, the dilutive effect of in-the-money employee stock options was approximately 117 million shares or 1.9% of the basic
shares outstanding based on the Company’s average share price of $19.00.
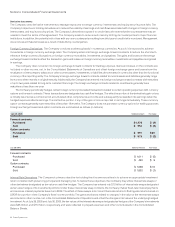
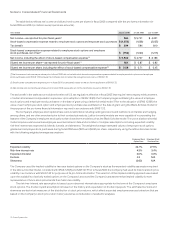
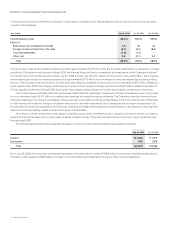
The Named Executive Ofcers represent the Company’s Chief Executive Ofcer and the four other most highly paid executive ofcers
whose salary and bonus for the years ended July 29, 2006 and July 30, 2005 were in excess of $100,000. The following table summarizes
the options granted to the Named Executive Ofcers during the scal years indicated:
Years Ended July 29, 2006 July 30, 2005
Stock options granted to the Named Executive Officers 3 million 4 million
Stock options granted to the Named Executive Officers as a percentage of net stock options granted 2.3% 2.2%
Stock options granted to the Named Executive Officers as a percentage of outstanding shares 0.05% 0.06%
Cumulative stock options held by Named Executive Officers as a percentage of total stock options outstanding 3.4% 4.1%
Notes to Consolidated Financial Statements