Cisco 2006 Annual Report Download - page 68
Download and view the complete annual report
Please find page 68 of the 2006 Cisco annual report below. You can navigate through the pages in the report by either clicking on the pages listed below, or by using the keyword search tool below to find specific information within the annual report.
2006 Annual Report 71
The expected life of employee stock options represents the weighted-average period the stock options are expected to remain
outstanding and is a derived output of the lattice-binomial model. The expected life of employee stock options is impacted by all of the
underlying assumptions and calibration of the Company’s model. The lattice-binomial model assumes that employees’ exercise behavior is
a function of the option’s remaining vested life and the extent to which the option is in-the-money. The lattice-binomial model estimates the
probability of exercise as a function of these two variables based on the entire history of exercises and cancellations on all past option grants
made by the Company. The expected life for option grants made during scal 2006 derived from the lattice-binomial model was 6.6 years.
Because stock-based compensation expense recognized in the Consolidated Statement of Operations for scal 2006 is based on
awards ultimately expected to vest, it has been reduced for estimated forfeitures. SFAS 123(R) requires forfeitures to be estimated at the
time of grant and revised, if necessary, in subsequent periods if actual forfeitures differ from those estimates. Forfeitures were estimated
based on historical experience and the Company expects forfeitures to be 3% annually. In the Company’s pro forma information required
under SFAS 123 for the periods prior to scal 2006, the Company accounted for forfeitures as they occurred.
Pro Forma Information Under SFAS 123 for Fiscal Years Prior to 2006 Pro forma information regarding option grants made to the Company’s
employees and directors and employee stock purchases is as follows (in millions, except per-share amounts):
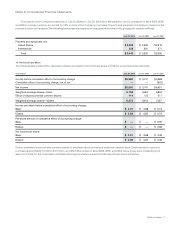
Years Ended July 30, 2005 July 31, 2004
Net income—as reported $ 5,741 $ 4,401
Stock-based compensation expense (1,628) (2,025)
Tax benefit 594 810
Stock-based compensation expense, net of tax (1,034) (1,215)
Net income—pro forma $ 4,707 $ 3,186
Basic net income per share—as reported $ 0.88 $ 0.64
Diluted net income per share—as reported $ 0.87 $ 0.62
Basic net income per share—pro forma $ 0.73 $ 0.47
Diluted net income per share—pro forma $ 0.71 $ 0.45
The weighted-average estimated value of employee stock options granted during scal 2005 and scal 2004 were $6.19 and $8.77,
respectively, using the Black-Scholes model with the following weighted-average assumptions:
EMPLOYEE STOCK
OPTION PLANS
EMPLOYEE STOCK
PURCHASE PLAN
July 30, 2005 July 31, 2004 July 30, 2005 July 31, 2004
Expected volatility 39.6% 40.0% 33.2% 43.2%
Risk-free interest rate 3.6% 3.9% 2.0% 2.8%
Expected dividend 0.0% 0.0% 0.0% 0.0%
Expected life (in years) 3.3 5.6 0.6 1.9
Prior to scal 2006, the Company used an option-pricing model to indirectly estimate the expected life of the stock options. The expected
life and expected volatility of the stock options were based upon historical and other economic data trended into the future. Forfeitures of
employee stock options were accounted for on an as-incurred basis.
Notes to Consolidated Financial Statements


