Cisco 2006 Annual Report Download - page 73
Download and view the complete annual report
Please find page 73 of the 2006 Cisco annual report below. You can navigate through the pages in the report by either clicking on the pages listed below, or by using the keyword search tool below to find specific information within the annual report.-
 1
1 -
2
-
3
-
4
-
5
-
6
-
7
-
8
-
9
-
10
-
11
-
12
-
13
-
14
-
15
-
16
-
17
-
18
-
19
-
20
-
21
-
22
-
23
-
24
-
25
-
26
-
27
-
28
-
29
-
30
-
31
-
32
-
33
-
34
-
35
-
36
-
37
-
38
-
39
-
40
-
41
-
42
-
43
-
44
-
45
-
46
-
47
-
48
-
49
-
50
-
51
-
52
-
53
-
54
-
55
-
56
-
57
-
58
-
59
-
60
-
61
-
62
-
 63
63 -
 64
64 -
 65
65 -
 66
66 -
 67
67 -
 68
68 -
 69
69 -
 70
70 -
 71
71 -
 72
72 -
 73
73 -
 74
74 -
 75
75 -
 76
76 -
 77
77 -
 78
78 -
 79
79
 |
 |

76 Cisco Systems, Inc.
12. Segment Information and Major Customers
The Company’s operations involve the design, development, manufacturing, marketing, and technical support of networking and other
products and services related to the communications and other information technology industry. Cisco products include routers, switches,
advanced technologies, and other products. These products, primarily integrated by Cisco IOS Software, link geographically dispersed
local-area networks (LANs) and wide-area networks (WANs).
The Company conducts business globally and is managed geographically. The Company’s management makes nancial decisions
and allocates resources based on the information it receives from its internal management system. Sales are attributed to a geographic
theater based on the ordering location of the customer. The Company does not allocate research and development, sales and marketing, or
general and administrative expenses to its geographic theaters in this internal management system because management does not currently
use the information to measure the performance of the operating segments. As a result of organizational changes, beginning in scal 2006,
the Company’s reportable segments were changed to the following theaters: United States and Canada; European Markets; Emerging
Markets; Asia Pacic; and Japan, and the Company has recast the geographic theater data for the prior scal years to reect this change in
reportable segments to conform to the current year’s presentation. Prior to scal 2006, the Company had four reportable segments: the
Americas; Europe, the Middle East, and Africa (EMEA); Asia Pacic; and Japan.
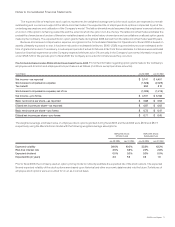
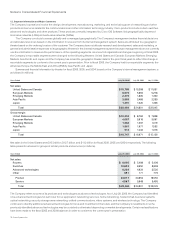
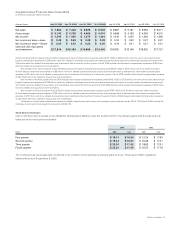
Summarized nancial information by theater for scal 2006, 2005, and 2004, based on the Company’s internal management system, is
as follows (in millions):
Years Ended July 29, 2006 July 30, 2005 July 31, 2004
Net sales:
United States and Canada $ 15,785 $ 13,298 $ 11,631
European Markets 6,079 5,692 5,278
Emerging Markets 2,476 1,805 1,450
Asia Pacific 2,853 2,486 2,230
Japan 1,291 1,520 1,456
Total $ 28,484 $ 24,801 $ 22,045
Gross margin:
United States and Canada $ 10,234 $ 8,784 $ 7,838
European Markets 4,057 3,916 3,661
Emerging Markets 1,682 1,267 1,019
Asia Pacific 1,861 1,671 1,532
Japan 913 1,033 1,076
Total $ 18,747 $ 16,671 $ 15,126
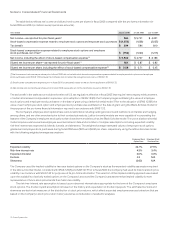
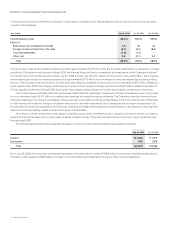
Net sales in the United States were $15.0 billion, $12.7 billion, and $11.2 billion for scal 2006, 2005, and 2004, respectively. The following
table presents net sales for groups of similar products and services (in millions):
Years Ended July 29, 2006 July 30, 2005 July 31, 2004
Net sales:
Routers $ 6,005 $ 5,498 $ 5,406
Switches 10,833 9,950 8,838
Advanced technologies 6,228 4,634 3,530
Other 851 771 776
Product 23,917 20,853 18,550
Service 4,567 3,948 3,495
Total $ 28,484 $ 24,801 $ 22,045
The Company refers to some of its products and technologies as advanced technologies. As of July 29, 2006, the Company had identied
nine advanced technologies for particular focus: application networking services, home networking, hosted small-business systems,
optical networking, security, storage area networking, unied communications, video systems, and wireless technology. The Company
continues to identify additional advanced technologies for focus and investment in the future, and the Company’s investments in some
previously identied advanced technologies may be curtailed or eliminated depending on market developments. Certain reclassications
have been made to the scal 2005 and 2004 balances in order to conform to the current year’s presentation.
Notes to Consolidated Financial Statements