Cisco 2006 Annual Report Download - page 22
Download and view the complete annual report
Please find page 22 of the 2006 Cisco annual report below. You can navigate through the pages in the report by either clicking on the pages listed below, or by using the keyword search tool below to find specific information within the annual report.-
 1
1 -
2
-
3
-
4
-
5
-
6
-
7
-
8
-
9
-
10
-
11
-
 12
12 -
 13
13 -
 14
14 -
 15
15 -
 16
16 -
 17
17 -
 18
18 -
 19
19 -
 20
20 -
 21
21 -
 22
22 -
 23
23 -
 24
24 -
 25
25 -
 26
26 -
 27
27 -
 28
28 -
 29
29 -
 30
30 -
 31
31 -
 32
32 -
33
-
34
-
35
-
36
-
37
-
38
-
39
-
40
-
41
-
42
-
43
-
44
-
45
-
46
-
47
-
48
-
49
-
50
-
51
-
52
-
53
-
54
-
55
-
56
-
57
-
58
-
59
-
60
-
61
-
62
-
63
-
64
-
65
-
66
-
67
-
68
-
69
-
70
-
71
-
72
-
73
-
74
-
75
-
76
-
77
-
78
-
79
 |
 |
2006 Annual Report 25
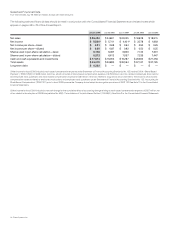
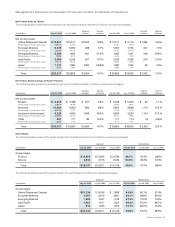
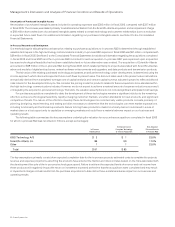
Net Product Sales by Theater
The following table presents the breakdown of net product sales by theater (in millions, except percentages):
Years Ended July 30, 2005
Variance
in Dollars
Variance
in Percent July 30, 2005 July 31, 2004
Variance
in Dollars
Variance
in PercentJuly 29, 2006
Net product sales:
United States and Canada $ 12,601 $ 10,511 $ 2,090 19.9% $ 10,511 $ 9,116 $ 1,395 15.3%
Percentage of net product sales 52.7% 50.4% 50.4% 49.1%
European Markets 5,339 5,050 289 5.7% 5,050 4,703 347 7.4%
Percentage of net product sales 22.3% 24.2% 24.2% 25.4%
Emerging Markets 2,296 1,665 631 37.9% 1,665 1,347 318 23.6%
Percentage of net product sales 9.6% 8.0% 8.0% 7.3%
Asia Pacific 2,550 2,243 307 13.7% 2,243 2,039 204 10.0%
Percentage of net product sales 10.7% 10.8% 10.8% 11.0%
Japan 1,131 1,384 (253) (18.3)% 1,384 1,345 39 2.9%
Percentage of net product sales 4.7% 6.6% 6.6% 7.2%
Total $ 23,917 $ 20,853 $ 3,064 14.7% $ 20,853 $ 18,550 $ 2,303 12.4%
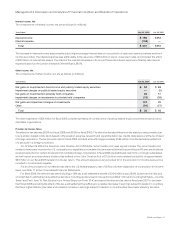
Net Product Sales by Groups of Similar Products
The following table presents net sales for groups of similar products (in millions, except percentages):
Years Ended July 30, 2005
Variance
in Dollars
Variance
in Percent July 30, 2005 July 31, 2004
Variance
in Dollars
Variance
in PercentJuly 29, 2006
Net product sales:
Routers $ 6,005 $ 5,498 $ 507 9.2% $ 5,498 $ 5,406 $ 92 1.7 %
Percentage of net product sales 25.1% 26.4% 26.4% 29.1%
Switches 10,833 9,950 883 8.9% 9,950 8,838 1,112 12.6 %
Percentage of net product sales 45.3% 47.7% 47.7% 47.7%
Advanced technologies 6,228 4,634 1,594 34.4% 4,634 3,530 1,104 31.3 %
Percentage of net product sales 26.0% 22.2% 22.2% 19.0%
Other 851 771 80 10.4% 771 776 (5) (0.6)%
Percentage of net product sales 3.6% 3.7% 3.7% 4.2%
Total $ 23,917 $ 20,853 $ 3,064 14.7% $ 20,853 $ 18,550 $ 2,303 12.4 %
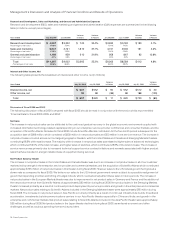
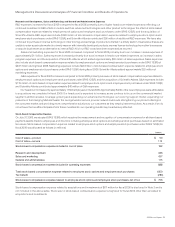
Gross Margin
The following table presents the gross margin for products and services (in millions, except percentages):
AMOUNT PERCENTAGE
Years Ended July 29, 2006 July 30, 2005 July 31, 2004 July 29, 2006 July 30, 2005 July 31, 2004
Gross margin:
Product $ 15,803 $ 14,095 $ 12,784 66.1% 67.6% 68.9%
Service 2,944 2,576 2,342 64.5% 65.2% 67.0%
Total $ 18,747 $ 16,671 $ 15,126 65.8% 67.2% 68.6%
The following table presents the gross margin for each theater (in millions, except percentages):
AMOUNT PERCENTAGE
Years Ended July 29, 2006 July 30, 2005 July 31, 2004 July 29, 2006 July 30, 2005 July 31, 2004
Gross margin:
United States and Canada $ 10,234 $ 8,784 $ 7,838 64.8% 66.1% 67.4%
European Markets 4,057 3,916 3,661 66.7% 68.8% 69.4%
Emerging Markets 1,682 1,267 1,019 67.9% 70.2% 70.3%
Asia Pacific 1,861 1,671 1,532 65.2% 67.2% 68.7%
Japan 913 1,033 1,076 70.7% 68.0% 73.9%
Total $ 18,747 $ 16,671 $ 15,126 65.8% 67.2% 68.6%
Management’s Discussion and Analysis of Financial Condition and Results of Operations