Cisco 2006 Annual Report Download - page 42
Download and view the complete annual report
Please find page 42 of the 2006 Cisco annual report below. You can navigate through the pages in the report by either clicking on the pages listed below, or by using the keyword search tool below to find specific information within the annual report.-
 1
1 -
2
-
3
-
4
-
5
-
6
-
7
-
8
-
9
-
10
-
11
-
12
-
13
-
14
-
15
-
16
-
17
-
18
-
19
-
20
-
21
-
22
-
23
-
24
-
25
-
26
-
27
-
28
-
29
-
30
-
31
-
 32
32 -
 33
33 -
 34
34 -
 35
35 -
 36
36 -
 37
37 -
 38
38 -
 39
39 -
 40
40 -
 41
41 -
 42
42 -
 43
43 -
 44
44 -
 45
45 -
 46
46 -
 47
47 -
 48
48 -
 49
49 -
 50
50 -
 51
51 -
 52
52 -
53
-
54
-
55
-
56
-
57
-
58
-
59
-
60
-
61
-
62
-
63
-
64
-
65
-
66
-
67
-
68
-
69
-
70
-
71
-
72
-
73
-
74
-
75
-
76
-
77
-
78
-
79
 |
 |

2006 Annual Report 45
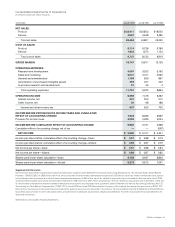
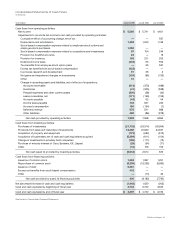
Years Ended July 29, 2006 July 30, 2005 July 31, 2004
Cash flows from operating activities:
Net income $ 5,580 $ 5,741 $ 4,401
Adjustments to reconcile net income to net cash provided by operating activities:
Cumulative effect of accounting change, net of tax — — 567
Depreciation and amortization 1,293 1,020 1,199
Stock-based compensation expense related to employee stock options and
employee stock purchases 1,050 — —
Stock-based compensation expense related to acquisitions and investments 87 154 244
Provision for doubtful accounts 24 — 19
Provision for inventory 162 221 205
Deferred income taxes (343) 55 552
Tax benefits from employee stock option plans — 35 537
Excess tax benefits from stock-based compensation (432) — —
In-process research and development 91 26 3
Net gains and impairment charges on investments (124) (95) (155)
Other 31 — —
Change in operating assets and liabilities, net of effects of acquisitions:
Accounts receivable (913) (373) (488)
Inventories (41) (305) (538)
Prepaid expenses and other current assets (300) (58) (42)
Lease receivables, net (171) (163) (159)
Accounts payable (43) 62 54
Income taxes payable 743 947 260
Accrued compensation 150 (154) (7)
Deferred revenue 575 541 688
Other liabilities 480 (86) (378)
Net cash provided by operating activities 7,899 7,568 6,962
Cash flows from investing activities:
Purchases of investments (21,732) (20,314) (33,054)
Proceeds from sales and maturities of investments 18,480 24,630 34,327
Acquisition of property and equipment (772) (692) (613)
Acquisition of businesses, net of cash and cash equivalents acquired (5,399) (911) (104)
Change in investments in privately held companies (186) (171) (13)
Purchase of minority interest of Cisco Systems, K.K. (Japan) (25) (34) (71)
Other (10) 106 153
Net cash (used in) provided by investing activities (9,644) 2,614 625
Cash flows from financing activities:
Issuance of common stock 1,682 1,087 1,257
Repurchase of common stock (8,295) (10,235) (9,080)
Issuance of debt 6,481 — —
Excess tax benefits from stock-based compensation 432 — —
Other — (14) 33
Net cash provided by (used in) financing activities 300 (9,162) (7,790)
Net (decrease) increase in cash and cash equivalents (1,445) 1,020 (203)
Cash and cash equivalents, beginning of fiscal year 4,742 3,722 3,925
Cash and cash equivalents, end of fiscal year $ 3,297 $ 4,742 $ 3,722
See Notes to Consolidated Financial Statements.
Consolidated Statements of Cash Flows
(in millions)