Cisco 2006 Annual Report Download - page 21
Download and view the complete annual report
Please find page 21 of the 2006 Cisco annual report below. You can navigate through the pages in the report by either clicking on the pages listed below, or by using the keyword search tool below to find specific information within the annual report.-
 1
1 -
2
-
3
-
4
-
5
-
6
-
7
-
8
-
9
-
10
-
 11
11 -
 12
12 -
 13
13 -
 14
14 -
 15
15 -
 16
16 -
 17
17 -
 18
18 -
 19
19 -
 20
20 -
 21
21 -
 22
22 -
 23
23 -
 24
24 -
 25
25 -
 26
26 -
 27
27 -
 28
28 -
 29
29 -
 30
30 -
 31
31 -
32
-
33
-
34
-
35
-
36
-
37
-
38
-
39
-
40
-
41
-
42
-
43
-
44
-
45
-
46
-
47
-
48
-
49
-
50
-
51
-
52
-
53
-
54
-
55
-
56
-
57
-
58
-
59
-
60
-
61
-
62
-
63
-
64
-
65
-
66
-
67
-
68
-
69
-
70
-
71
-
72
-
73
-
74
-
75
-
76
-
77
-
78
-
79
 |
 |

24 Cisco Systems, Inc.
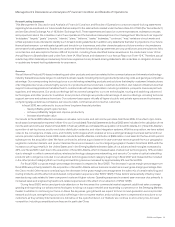
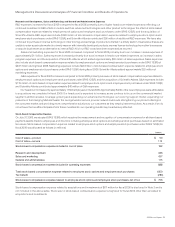
Our effective tax rates differ from the statutory rate primarily due to acquisition-related costs, stock-based compensation, research
and experimentation tax credits, state taxes, and the tax impact of foreign operations. The effective tax rate was 26.9%, 28.6%, and 28.9%
for scal 2006, 2005, and 2004, respectively. The tax provision rate for scal 2006 reected a benet of approximately $124 million from the
favorable settlement of a tax audit in a foreign jurisdiction. Our future effective tax rates could be adversely affected by earnings being lower
than anticipated in countries where we have lower statutory rates and higher than anticipated in countries where we have higher statutory
rates, by changes in the valuation of our deferred tax assets or liabilities, or by changes in tax laws, regulations, accounting principles, or
interpretations thereof. In addition, we are subject to the continuous examination of our income tax returns by the Internal Revenue Service and
other tax authorities. We regularly assess the likelihood of adverse outcomes resulting from these examinations to determine the adequacy
of our provision for income taxes.
Loss Contingencies
We are subject to the possibility of various losses arising in the ordinary course of business. We consider the likelihood of loss or impairment
of an asset or the incurrence of a liability, as well as our ability to reasonably estimate the amount of loss, in determining loss contingencies.
An estimated loss contingency is accrued when it is probable that an asset has been impaired or a liability has been incurred and the amount
of loss can be reasonably estimated. We regularly evaluate current information available to us to determine whether such accruals should
be adjusted and whether new accruals are required.
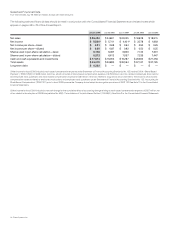
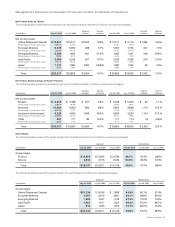
Financial Data for Fiscal 2006, 2005, and 2004
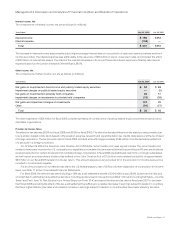
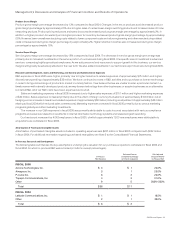
Net Sales
The following table presents the breakdown of net sales between product and service revenue (in millions, except percentages):
Years Ended July 30, 2005
Variance
in Dollars
Variance
in Percent July 30, 2005 July 31, 2004
Variance
in Dollars
Variance
in PercentJuly 29, 2006
Net sales:
Product $ 23,917 $ 20,853 $ 3,064 14.7% $ 20,853 $ 18,550 $ 2,303 12.4%
Percentage of net sales 84.0% 84.1% 84.1% 84.1%
Service 4,567 3,948 619 15.7% 3,948 3,495 453 13.0%
Percentage of net sales 16.0% 15.9% 15.9% 15.9%
Total $ 28,484 $ 24,801 $ 3,683 14.9% $ 24,801 $ 22,045 $ 2,756 12.5%
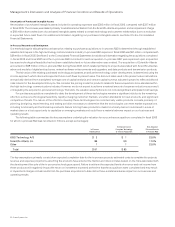
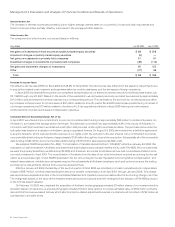
As a result of organizational changes, beginning in scal 2006, our reportable segments were changed to the following theaters: United States
and Canada; European Markets; Emerging Markets; Asia Pacic; and Japan. We have recast our scal 2005 and scal 2004 geographic
theater data to reect this change in reportable segments to conform to the current year’s presentation. Prior to scal 2006, we had four
reportable segments: the Americas; Europe, the Middle East, and Africa (EMEA); Asia Pacic; and Japan. Net sales, which include product
and service revenue, for each theater are summarized in the following table (in millions, except percentages):
Years Ended July 30, 2005
Variance
in Dollars
Variance
in Percent July 30, 2005 July 31, 2004
Variance
in Dollars
Variance
in PercentJuly 29, 2006
Net sales:
United States and Canada $ 15,785 $ 13,298 $ 2,487 18.7% $ 13,298 $ 11,631 $ 1,667 14.3%
Percentage of net sales 55.4% 53.6% 53.6% 52.8%
European Markets 6,079 5,692 387 6.8% 5,692 5,278 414 7.8%
Percentage of net sales 21.4% 23.0% 23.0% 23.9%
Emerging Markets 2,476 1,805 671 37.2% 1,805 1,450 355 24.5%
Percentage of net sales 8.7% 7.3% 7.3% 6.6%
Asia Pacific 2,853 2,486 367 14.8% 2,486 2,230 256 11.5%
Percentage of net sales 10.0% 10.0% 10.0% 10.1%
Japan 1,291 1,520 (229) (15.1)% 1,520 1,456 64 4.4%
Percentage of net sales 4.5% 6.1% 6.1% 6.6%
Total $ 28,484 $ 24,801 $ 3,683 14.9% $ 24,801 $ 22,045 $ 2,756 12.5%
Management’s Discussion and Analysis of Financial Condition and Results of Operations