Cisco 2006 Annual Report Download - page 57
Download and view the complete annual report
Please find page 57 of the 2006 Cisco annual report below. You can navigate through the pages in the report by either clicking on the pages listed below, or by using the keyword search tool below to find specific information within the annual report.-
 1
1 -
2
-
3
-
4
-
5
-
6
-
7
-
8
-
9
-
10
-
11
-
12
-
13
-
14
-
15
-
16
-
17
-
18
-
19
-
20
-
21
-
22
-
23
-
24
-
25
-
26
-
27
-
28
-
29
-
30
-
31
-
32
-
33
-
34
-
35
-
36
-
37
-
38
-
39
-
40
-
41
-
42
-
43
-
44
-
45
-
46
-
 47
47 -
 48
48 -
 49
49 -
 50
50 -
 51
51 -
 52
52 -
 53
53 -
 54
54 -
 55
55 -
 56
56 -
 57
57 -
 58
58 -
 59
59 -
 60
60 -
 61
61 -
 62
62 -
 63
63 -
 64
64 -
 65
65 -
 66
66 -
 67
67 -
68
-
69
-
70
-
71
-
72
-
73
-
74
-
75
-
76
-
77
-
78
-
79
 |
 |
60 Cisco Systems, Inc.
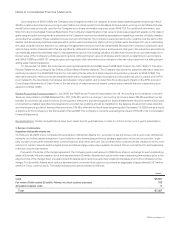
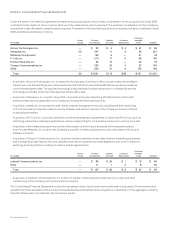
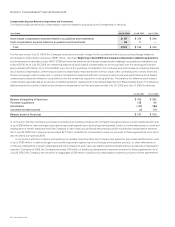
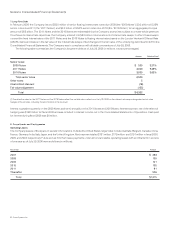
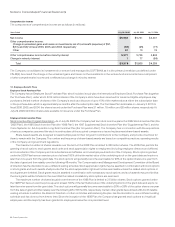
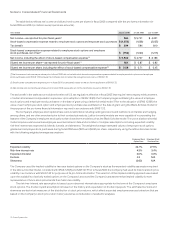
5. Lease Receivables, Net
Lease receivables represent sales-type and direct-nancing leases resulting from the sale of the Company’s and complementary third-party
products and services. These lease arrangements typically have terms from two to three years and are generally collateralized by a security
interest in the underlying assets. The current portion of lease receivables, net, is recorded in prepaid expenses and other current assets,
and the noncurrent portion is recorded in other assets in the Consolidated Balance Sheets. The net lease receivables are summarized as
follows (in millions):
July 29, 2006 July 30, 2005
Gross lease receivables $ 960 $ 731
Unearned income and other allowances (188) (130)
Total $ 772 $ 601
Reported as:
Current $ 308 $ 248
Noncurrent 464 353
Total $ 772 $ 601
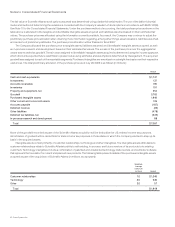
Contractual maturities of the gross lease receivables at July 29, 2006 were $369 million in scal 2007, $302 million in scal 2008, $177 million
in scal 2009, $81 million in scal 2010, and $31 million in scal 2011 and thereafter. Actual cash collections may differ from the contractual
maturities due to early customer buyouts, renancings, or defaults.
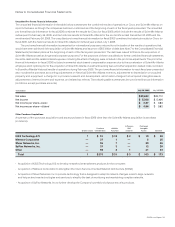
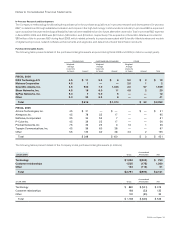
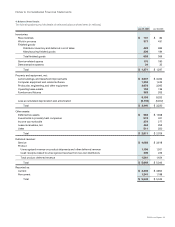
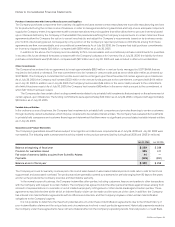
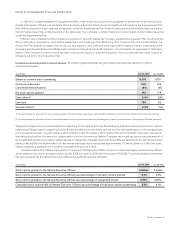
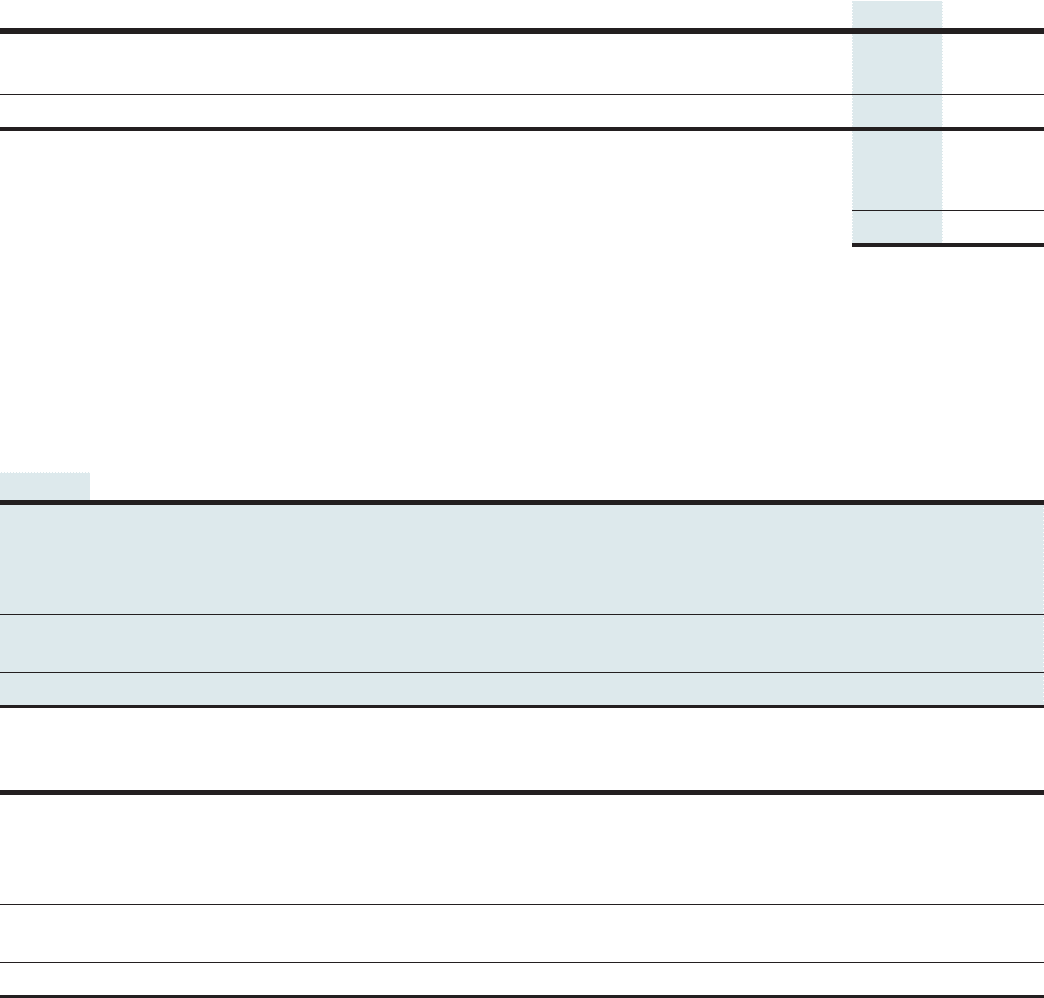
6. Investments
The following tables summarize the Company’s investments (in millions):
Amortized
Cost
Gross
Unrealized
Gains
Gross
Unrealized
Losses
Fair
ValueJuly 29, 2006
Fixed income securities:
U.S. government notes and bonds $ 5,179 $ 3 $ (47) $ 5,135
Corporate notes, bonds, and asset-backed securities 7,950 2 (88) 7,864
Municipal notes and bonds 809 — (3) 806
Total fixed income securities 13,938 5 (138) 13,805
Publicly traded equity securities 467 252 (7) 712
Total $ 14,405 $ 257 $ (145) $ 14,517
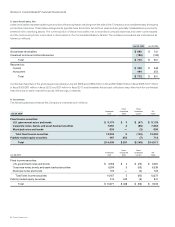
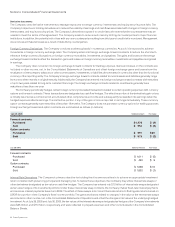
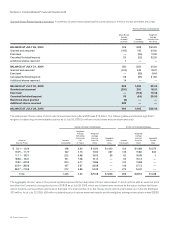
Amortized
Cost
Gross
Unrealized
Gains
Gross
Unrealized
Losses
Fair
ValueJuly 30, 2005
Fixed income securities:
U.S. government notes and bonds $ 3,453 $ 2 $ (25) $ 3,430
Corporate notes, bonds, and asset-backed securities 6,299 3 (63) 6,239
Municipal notes and bonds 705 — (2) 703
Total fixed income securities 10,457 5 (90) 10,372
Publicly traded equity securities 514 433 (6) 941
Total $ 10,971 $ 438 $ (96) $ 11,313
Notes to Consolidated Financial Statements