Cisco 2006 Annual Report Download - page 52
Download and view the complete annual report
Please find page 52 of the 2006 Cisco annual report below. You can navigate through the pages in the report by either clicking on the pages listed below, or by using the keyword search tool below to find specific information within the annual report.-
 1
1 -
2
-
3
-
4
-
5
-
6
-
7
-
8
-
9
-
10
-
11
-
12
-
13
-
14
-
15
-
16
-
17
-
18
-
19
-
20
-
21
-
22
-
23
-
24
-
25
-
26
-
27
-
28
-
29
-
30
-
31
-
32
-
33
-
34
-
35
-
36
-
37
-
38
-
39
-
40
-
41
-
 42
42 -
 43
43 -
 44
44 -
 45
45 -
 46
46 -
 47
47 -
 48
48 -
 49
49 -
 50
50 -
 51
51 -
 52
52 -
 53
53 -
 54
54 -
 55
55 -
 56
56 -
 57
57 -
 58
58 -
 59
59 -
 60
60 -
 61
61 -
 62
62 -
63
-
64
-
65
-
66
-
67
-
68
-
69
-
70
-
71
-
72
-
73
-
74
-
75
-
76
-
77
-
78
-
79
 |
 |

2006 Annual Report 55
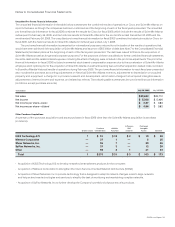
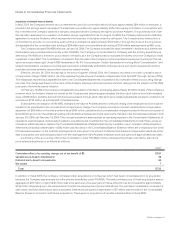
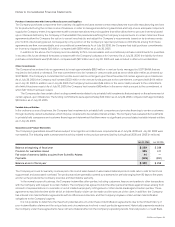
In-Process Research and Development
The Company’s methodology for allocating the purchase price for purchase acquisitions to in-process research and development (“in-process
R&D”) is determined through established valuation techniques in the high-technology communications industry. In-process R&D is expensed
upon acquisition because technological feasibility has not been established and no future alternative uses exist. Total in-process R&D expense
in scal 2006, 2005, and 2004 was $91 million, $26 million, and $3 million, respectively. The acquisition of Scientic-Atlanta accounted for
$88 million of the in-process R&D during scal 2006, which related primarily to projects associated with Scientic-Atlanta’s advanced models
of digital set-top boxes, network software enhancements and upgrades, and data products and transmission products.
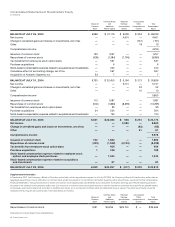
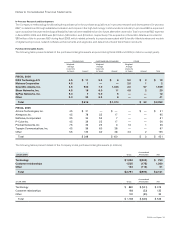
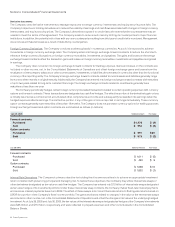
Purchased Intangible Assets
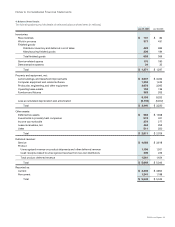
The following table presents details of the purchased intangible assets acquired during scal 2006 and 2005 (in millions, except years):
TECHNOLOGY CUSTOMER RELATIONSHIPS OTHER
Weighted-
Average
Useful Life
(in Years) Amount
Weighted-
Average
Useful Life
(in Years) Amount
Weighted-
Average
Useful Life
(in Years) Amount Total
FISCAL 2006
KiSS Technology A/S 4.5 $ 11 5.5 $ 6 5.0 $ 2 $ 19
Metreos Corporation 4.5 1 — — 2.0 1 2
Scientific-Atlanta, Inc. 3.5 546 7.0 1,346 2.0 57 1,949
Sheer Networks, Inc. 4.5 16 6.0 11 4.5 2 29
SyPixx Networks, Inc. 5.0 7 5.0 5 — — 12
Other 5.0 35 6.5 6 — — 41
Total $ 616 $ 1,374 $ 62 $ 2,052
FISCAL 2005
Actona Technologies, Inc. 4.5 $ 21 — $ — — $ — $ 21
Airespace, Inc. 4.5 78 3.5 17 — — 95
NetSolve, Incorporated 3.5 24 5.5 7 — — 31
P–Cube Inc. 4.5 39 2.5 17 — — 56
Procket Networks, Inc. 7.5 22 2.5 3 1.0 1 26
Topspin Communications, Inc. 4.5 39 6.0 28 — — 67
Other 5.5 125 3.0 28 2.0 2 155
Total $ 348 $ 100 $ 3 $ 451
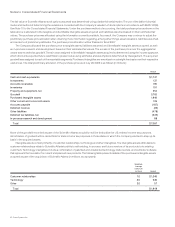
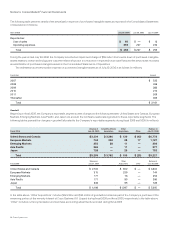
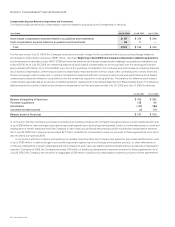
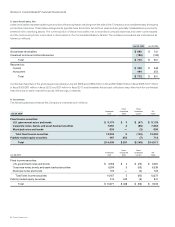
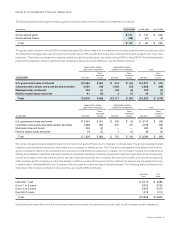
The following tables present details of the Company’s total purchased intangible assets (in millions):
Gross
Accumulated
Amortization NetJuly 29, 2006
Technology $ 1,052 $ (302) $ 750
Customer relationships 1,535 (175) 1,360
Other 164 (113) 51
Total $ 2,751 $ (590) $ 2,161
July 30, 2005 Gross
Accumulated
Amortization Net
Technology $ 880 $ (501) $ 379
Customer relationships 188 (53) 135
Other 130 (95) 35
Total $ 1,198 $ (649) $ 549
Notes to Consolidated Financial Statements