Cigna 2011 Annual Report Download - page 92
Download and view the complete annual report
Please find page 92 of the 2011 Cigna annual report below. You can navigate through the pages in the report by either clicking on the pages listed below, or by using the keyword search tool below to find specific information within the annual report.
70 CIGNA CORPORATION2011 Form10K
PART II
ITEM 8 Financial Statements and Supplementary Data
Cigna Corporation
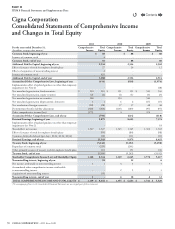
Consolidated Statements of Comprehensive Income
and Changes in Total Equity
For the years ended December31,
(In millions, except per share amounts)
2011 2010 2009
Comprehensive
Income
Total
Equity
Comprehensive
Income
Total
Equity
Comprehensive
Income
Total
Equity
Common Stock, beginning of year $ 88 $ 88 $ 88
Issuance of common stock 4 - -
Common Stock, end of year 92 88 88
Additional Paid-In Capital, beginning of year 2,534 2,514 2,502
Eect of issuance of stock for employee benet plans 27 20 12
Eects of acquisition of noncontrolling interest 2 - -
Issuance of common stock 625 - -
Additional Paid-In Capital, end of year 3,188 2,534 2,514
Accumulated Other Comprehensive Loss, beginning of year (614) (618) (1,074)
Implementation eect of updated guidance on other-than-temporary
impairments (see Note 2) - - (18)
Net unrealized appreciation, xed maturities $ 210 210 $ 151 151 $ 543 543
Net unrealized depreciation, equity securities (2) (2) (1) (1) (3) (3)
Net unrealized appreciation on securities 208 150 540
Net unrealized appreciation (depreciation), derivatives 1 1 6 6 (17) (17)
Net translation of foreign currencies (28) (28) 37 37 48 48
Postretirement benets liability adjustment (360) (360) (189) (189) (97) (97)
Other comprehensive income (loss) (179) 4 474
Accumulated Other Comprehensive Loss, end of year (793) (614) (618)
Retained Earnings, beginning of year 9,879 8,625 7,374
Implementation eect of updated guidance on other-than-temporary
impairments (see Note 2) - - 18
Shareholders’ net income 1,327 1,327 1,345 1,345 1,302 1,302
Eect of issuance of stock for employee benet plans (53) (80) (58)
Common dividends declared (per share: $0.04; $0.04; $0.04) (10) (11) (11)
Retained Earnings, end of year 11,143 9,879 8,625
Treasury Stock, beginning of year (5,242) (5,192) (5,298)
Repurchase of common stock (225) (201) -
Other, primarily issuance of treasury stock for employee benet plans 181 151 106
Treasury Stock, end of year (5,286) (5,242) (5,192)
Shareholders’ Comprehensive Income (Loss) and Shareholders’ Equity 1,148 8,344 1,349 6,645 1,776 5,417
Noncontrolling interest, beginning of year 18 12 6
Net income attributable to noncontrolling interest 1 1 4 4 3 3
Accumulated other comprehensive income attributable
tononcontrolling interest - - 2 2 3 3
Acquisition of noncontrolling interest (19)
Noncontrolling interest, end of year 1 - 6 18 6 12
TOTAL COMPREHENSIVE INCOME AND TOTAL EQUITY $ 1,149 $ 8,344 $ 1,355 $ 6,663 $ 1,782 $ 5,429
The accompanying Notes to the Consolidated Financial Statements are an integral part of these statements.
Contents
Q


