Cigna 2011 Annual Report Download - page 79
Download and view the complete annual report
Please find page 79 of the 2011 Cigna annual report below. You can navigate through the pages in the report by either clicking on the pages listed below, or by using the keyword search tool below to find specific information within the annual report.-
 1
1 -
2
-
3
-
4
-
5
-
6
-
7
-
8
-
9
-
10
-
11
-
12
-
13
-
14
-
15
-
16
-
17
-
18
-
19
-
20
-
21
-
22
-
23
-
24
-
25
-
26
-
27
-
28
-
29
-
30
-
31
-
32
-
33
-
34
-
35
-
36
-
37
-
38
-
39
-
40
-
41
-
42
-
43
-
44
-
45
-
46
-
47
-
48
-
49
-
50
-
51
-
52
-
53
-
54
-
55
-
56
-
57
-
58
-
59
-
60
-
61
-
62
-
63
-
64
-
65
-
66
-
67
-
68
-
 69
69 -
 70
70 -
 71
71 -
 72
72 -
 73
73 -
 74
74 -
 75
75 -
 76
76 -
 77
77 -
 78
78 -
 79
79 -
 80
80 -
 81
81 -
 82
82 -
 83
83 -
 84
84 -
 85
85 -
 86
86 -
 87
87 -
 88
88 -
 89
89 -
90
-
91
-
92
-
93
-
94
-
95
-
96
-
97
-
98
-
99
-
100
-
101
-
102
-
103
-
104
-
105
-
106
-
107
-
108
-
109
-
110
-
111
-
112
-
113
-
114
-
115
-
116
-
117
-
118
-
119
-
120
-
121
-
122
-
123
-
124
-
125
-
126
-
127
-
128
-
129
-
130
-
131
-
132
-
133
-
134
-
135
-
136
-
137
-
138
-
139
-
140
-
141
-
142
-
143
-
144
-
145
-
146
-
147
-
148
-
149
-
150
-
151
-
152
-
153
-
154
-
155
-
156
-
157
-
158
-
159
-
160
-
161
-
162
-
163
-
164
-
165
-
166
-
167
-
168
-
169
-
170
-
171
-
172
-
173
-
174
-
175
-
176
-
177
-
178
-
179
-
180
 |
 |

57CIGNA CORPORATION2011 Form10K
PART II
ITEM 7 Management’s Discussion and Analysis of Financial Condition and Results of Operations
Cash ows from operating activities increased by $998million in 2010
compared with 2009. Excluding the results of the GMDB equity hedge
program (that did not aect net income), cash ows from operating
activities increased by $873million. is increase in 2010 primarily
reects premium growth in the Health Care segment’s risk businesses
as noted above and earnings growth in the Health Care, Disability and
Life and International segments as well as lower contributions to the
qualied domestic pension plan ($212million in 2010, compared with
$410million in 2009). ese favorable eects were partially oset by
higher management compensation and income tax payments in 2010
compared with 2009.
Investing activities
Cash used in investing activities was $1.3billion. is use of cash
primarily consisted of net purchases of investments of $503million,
cash used to fund acquisitions (net of cash acquired) of $344million,
net cash used to transfer the run-o workers’ compensation and personal
accident assumed reinsurance business via a reinsurance transaction
of $190million, and net purchases of property and equipment of
$300million.
Financing activities
Cash provided from nancing activities primarily consisted of net
proceeds from the issuance of long-term debt of $543million, partially
oset by debt repayments of $270million primarily to retire a portion
of the 8.5% Notesdue 2019 and the 6.35% Notesdue 2018 as a result
of the tender oers to bondholders. See the Capital Resources section
for more information. Financing activities also included net deposits to
contractholder deposit funds of $90million and proceeds on issuances
of common stock of $64million. ese inows were partially oset
by common stock repurchases of $201million.
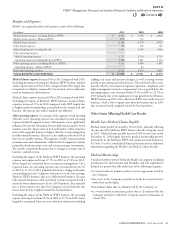
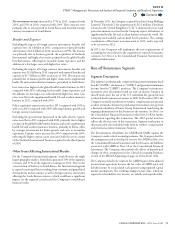
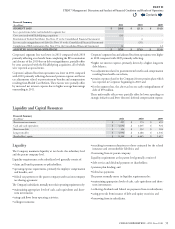
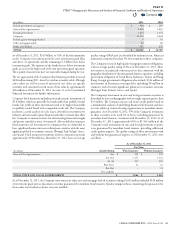
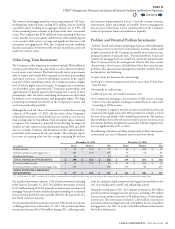
Interest Expense
Interest expense on long-term debt, short-term debt and capital leases
was as follows:
(In millions)
2011 2010 2009
Interest expense $ 202 $ 182 $ 166
e increase in interest expense in 2011 was primarily due to higher average borrowings in 2011 from issuing debt in Marchand November2011.
Capital Resources
e Company’s capital resources (primarily retained earnings and
the proceeds from the issuance of debt and equity securities) provide
protection for policyholders, furnish the nancial strength to underwrite
insurance risks and facilitate continued business growth.
Management, guided by regulatory requirements and rating agency
capital guidelines, determines the amount of capital resources that
the Company maintains. Management allocates resources to new
long-term business commitments when returns, considering the risks,
look promising and when the resources available to support existing
business are adequate.
e Company prioritizes its use of capital resources to:
•
provide capital necessary to support growth and maintain or improve
the nancial strength ratings of subsidiaries;
•
consider acquisitions that are strategically and economically
advantageous; and
•return capital to investors through share repurchase.
e availability of capital resources will be impacted by equity and
credit market conditions. Extreme volatility in credit or equity market
conditions may reduce the Company’s ability to issue debt or equity
securities.
Sources of Capital
Debt Financings
During 2011 and 2010, the Company entered into the following
debt nancings. For further information on these debt nancings, see
Note15 to the Consolidated Financial Statements.
•
On November10,2011, the Company issued $2.1billion of long-term
debt to fund the HealthSpring acquisition as follows: $600million
of 5-Year Notesat 2.75%, $750million of 10-Year Notesat 4%, and
$750million of 30-Year Notesat 5.375%.
•
In June2011, the Company entered into a new ve-year revolving
credit and letter of credit agreement for $1.5billion that permits up
to $500million to be used for letters of credit. e credit agreement
includes options that are subject to consent by the administrative agent
and the committing banks, to increase the commitment amount to
$2billion and to extend the term past June2016.
•
In March2011, the Company issued $300million of 10-Year Notesat
4.5% and $300million of 30-Year Notesat 5.875%. e proceeds
were used for general corporate purposes, including the repayment
of maturing debt in 2011.
•
In December2010, the Company issued $250million of 10-Year
Notesat 4.375%. e proceeds of this debt were used to fund the
tender oer for the Company’s 8.5% Senior Notesdue 2019 and
the 6.35% Senior Notesdue 2018 (described further below under
uses of capital).
•
In May2010, the Company issued $300million of 10-Year Notesat
5.125%. e proceeds of this debt were used for general corporate
purposes.
Equity Financing
On November16,2011, the Company issued 15.2million shares of
its common stock at $42.75 per share. Proceeds were $650million
($629million net of underwriting discount and fees). e proceeds
were used to fund the HealthSpring acquisition in January2012.
Contents
Q