Cigna 2011 Annual Report Download - page 74
Download and view the complete annual report
Please find page 74 of the 2011 Cigna annual report below. You can navigate through the pages in the report by either clicking on the pages listed below, or by using the keyword search tool below to find specific information within the annual report.-
 1
1 -
2
-
3
-
4
-
5
-
6
-
7
-
8
-
9
-
10
-
11
-
12
-
13
-
14
-
15
-
16
-
17
-
18
-
19
-
20
-
21
-
22
-
23
-
24
-
25
-
26
-
27
-
28
-
29
-
30
-
31
-
32
-
33
-
34
-
35
-
36
-
37
-
38
-
39
-
40
-
41
-
42
-
43
-
44
-
45
-
46
-
47
-
48
-
49
-
50
-
51
-
52
-
53
-
54
-
55
-
56
-
57
-
58
-
59
-
60
-
61
-
62
-
63
-
 64
64 -
 65
65 -
 66
66 -
 67
67 -
 68
68 -
 69
69 -
 70
70 -
 71
71 -
 72
72 -
 73
73 -
 74
74 -
 75
75 -
 76
76 -
 77
77 -
 78
78 -
 79
79 -
 80
80 -
 81
81 -
 82
82 -
 83
83 -
 84
84 -
85
-
86
-
87
-
88
-
89
-
90
-
91
-
92
-
93
-
94
-
95
-
96
-
97
-
98
-
99
-
100
-
101
-
102
-
103
-
104
-
105
-
106
-
107
-
108
-
109
-
110
-
111
-
112
-
113
-
114
-
115
-
116
-
117
-
118
-
119
-
120
-
121
-
122
-
123
-
124
-
125
-
126
-
127
-
128
-
129
-
130
-
131
-
132
-
133
-
134
-
135
-
136
-
137
-
138
-
139
-
140
-
141
-
142
-
143
-
144
-
145
-
146
-
147
-
148
-
149
-
150
-
151
-
152
-
153
-
154
-
155
-
156
-
157
-
158
-
159
-
160
-
161
-
162
-
163
-
164
-
165
-
166
-
167
-
168
-
169
-
170
-
171
-
172
-
173
-
174
-
175
-
176
-
177
-
178
-
179
-
180
 |
 |
52 CIGNA CORPORATION2011 Form10K
PART II
ITEM 7 Management’s Discussion and Analysis of Financial Condition and Results of Operations
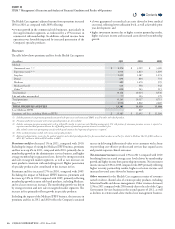
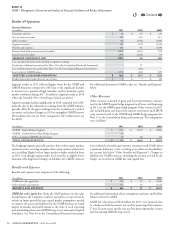
Results of Operations
Financial Summary
(In millions)
2011 2010 2009
Premiums and fees $ 24 $ 25 $ 29
Net investment income 103 114 113
Other revenues (4) (158) (283)
Segment revenues 123 (19) (141)
Benets and expenses 405 91 (419)
Income (loss) before income taxes (benets) (282) (110) 278
Income taxes (benets) (99) (136) 93
SEGMENT EARNINGS LOSS 183 26 185
Less: special items (after-tax) included in segment earnings:
Resolution of federal tax matters (See Note19 to the Consolidated Financial Statements) - 97 -
Loss on Reinsurance transaction (See Note3 to the Consolidated Financial Statements) - (20) -
Less: results of GMIB business (135) (24) 209
ADJUSTED LOSS FROM OPERATIONS $48 $27 $24
Realized investment gains (losses), net of taxes $ 4 $ 5 $ (2)
Segment results in 2011 reected higher losses for the GMIB and
GMDB businesses compared to 2010 due to the signicant declines
in interest rates, periods of high volatility, and less favorable equity
market conditions during 2011. In addition, segment results in 2010
reect the favorable eect of resolving a federal tax matter.
Segment earnings declined signicantly in 2010 compared with 2009,
primarily due to the reduction in earnings from the GMIB business,
partially oset by the gain resulting from the resolution of a federal
tax matter and reduced charges in 2010 to strengthen GMDB reserves
($34million after-tax for 2010, compared to $47million after-tax
for 2009).
For additional discussion of GMIB results, see “Benets and Expenses”
below.
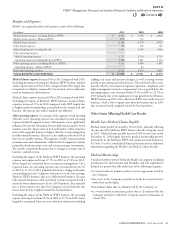
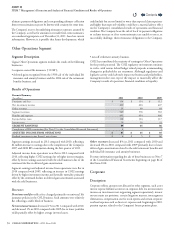
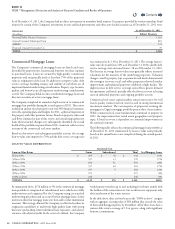
Other Revenues
Other revenues consisted of gains and losses from futures contracts
used in the GMDB equity hedge program for all years, and beginning
in 2011, for the GMIB equity hedge program. Other revenues in 2011
also included gains and losses from interest rate futures and LIBOR
swap contracts used in the GMDB and GMIB hedge programs (see
Note12 to the Consolidated Financial Statements). e components
were as follows:
(In millions)
2011 2010 2009
GMDB - Equity Hedge Program $ (45) $ (157) $ (282)
GMDB - Growth Interest Rate Hedge Program 31 - -
Other, including GMIB Hedge Programs 10 (1) (1)
TOTAL OTHER REVENUES $4 $ 158 $ 283
e hedging programs generally produce losses when equity markets
and interest rates are rising and gains when equity markets and interest
rates are falling. Higher levels of equity market volatility resulted in losses
in 2011, even though equity market levels were at to slightly lower.
Amounts reecting related changes in liabilities for GMDB contracts
were included in benets and expenses consistent with GAAP when
a premium deciency exists, resulting in no eect on shareholders’
net income (see below “Other Benets and Expenses”). Changes in
liabilities for GMIB contracts, including the portion covered by the
hedges, are recorded in GMIB fair value (gain) loss.
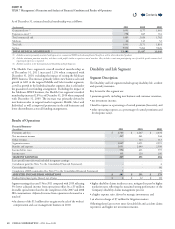
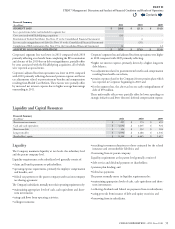
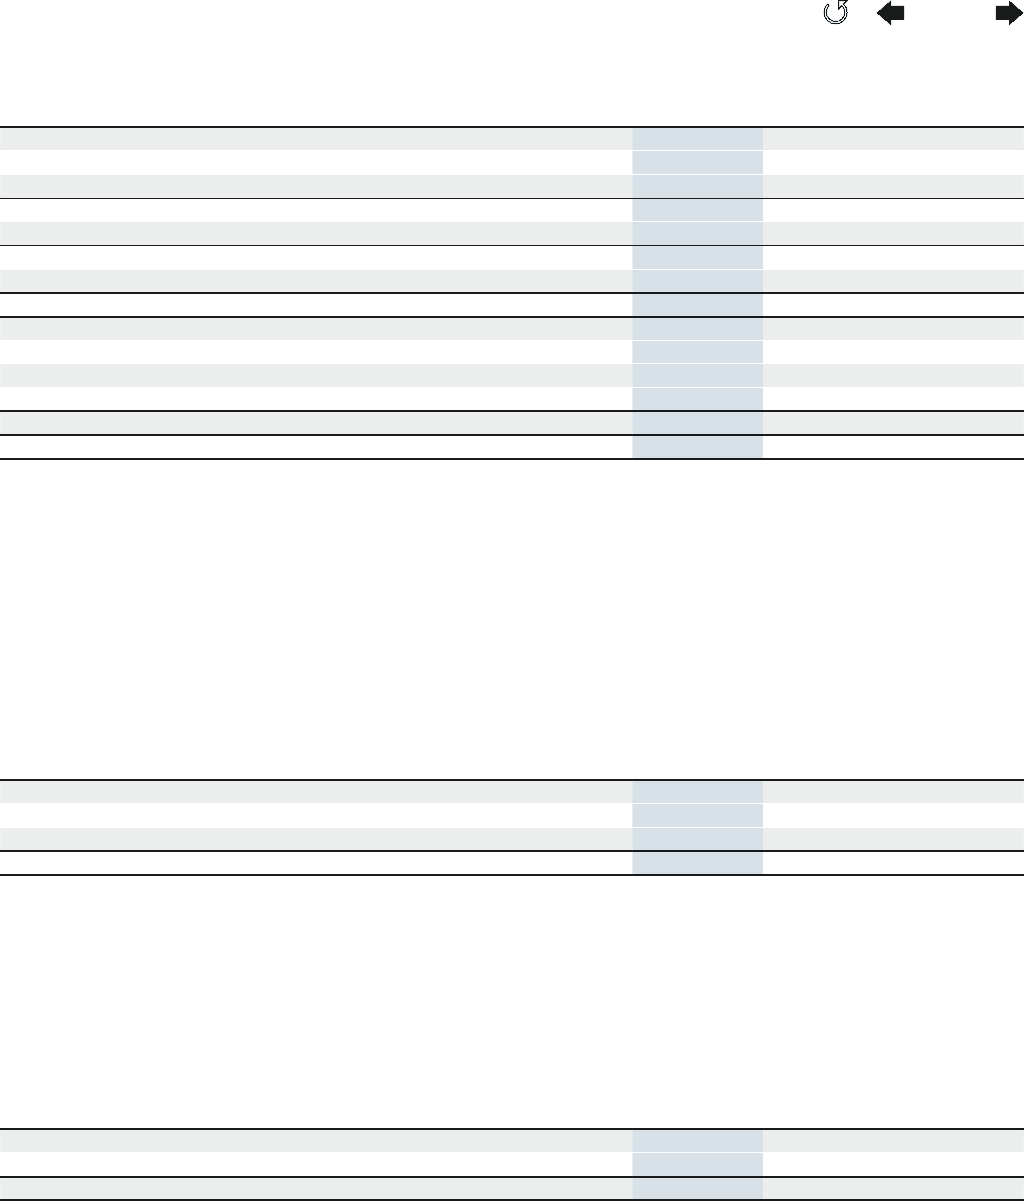
Benefits and Expenses
Benets and expenseswere comprised of the following:
(In millions)
2011 2010 2009
GMIB fair value (gain) loss $ 234 $ 55 $ (304)
Other benets and expenses 171 36 (115)
BENEFITS AND EXPENSES $ 405 $ 91 $ 419
GMIB fair value (gain) loss. Under the GAAP guidance for fair value
measurements, the Company’s results of operations are expected to be
volatile in future periods because capital market assumptions needed
to estimate the assets and liabilities for the GMIB business are based
largely on market-observable inputs at the close of each reporting
period including interest rates (LIBOR swap curve) and market-implied
volatilities. See Note10 to the Consolidated Financial Statements
for additional information about assumptions and asset and liability
balances related to GMIB.
GMIB fair value losses of $234million for 2011, were primarily due
to a decline in both the interest rate used for projecting claim exposure
(7-year Treasury rates) and the rate used for projecting market returns
and discounting (LIBOR swap curve).
Contents
Q