Cigna 2011 Annual Report Download - page 62
Download and view the complete annual report
Please find page 62 of the 2011 Cigna annual report below. You can navigate through the pages in the report by either clicking on the pages listed below, or by using the keyword search tool below to find specific information within the annual report.-
 1
1 -
2
-
3
-
4
-
5
-
6
-
7
-
8
-
9
-
10
-
11
-
12
-
13
-
14
-
15
-
16
-
17
-
18
-
19
-
20
-
21
-
22
-
23
-
24
-
25
-
26
-
27
-
28
-
29
-
30
-
31
-
32
-
33
-
34
-
35
-
36
-
37
-
38
-
39
-
40
-
41
-
42
-
43
-
44
-
45
-
46
-
47
-
48
-
49
-
50
-
51
-
 52
52 -
 53
53 -
 54
54 -
 55
55 -
 56
56 -
 57
57 -
 58
58 -
 59
59 -
 60
60 -
 61
61 -
 62
62 -
 63
63 -
 64
64 -
 65
65 -
 66
66 -
 67
67 -
 68
68 -
 69
69 -
 70
70 -
 71
71 -
 72
72 -
73
-
74
-
75
-
76
-
77
-
78
-
79
-
80
-
81
-
82
-
83
-
84
-
85
-
86
-
87
-
88
-
89
-
90
-
91
-
92
-
93
-
94
-
95
-
96
-
97
-
98
-
99
-
100
-
101
-
102
-
103
-
104
-
105
-
106
-
107
-
108
-
109
-
110
-
111
-
112
-
113
-
114
-
115
-
116
-
117
-
118
-
119
-
120
-
121
-
122
-
123
-
124
-
125
-
126
-
127
-
128
-
129
-
130
-
131
-
132
-
133
-
134
-
135
-
136
-
137
-
138
-
139
-
140
-
141
-
142
-
143
-
144
-
145
-
146
-
147
-
148
-
149
-
150
-
151
-
152
-
153
-
154
-
155
-
156
-
157
-
158
-
159
-
160
-
161
-
162
-
163
-
164
-
165
-
166
-
167
-
168
-
169
-
170
-
171
-
172
-
173
-
174
-
175
-
176
-
177
-
178
-
179
-
180
 |
 |

40 CIGNA CORPORATION2011 Form10K
PART II
ITEM 7 Management’s Discussion and Analysis of Financial Condition and Results of Operations
performance, will be consistent with long-term reserve assumptions. See
Note6 to the Consolidated Financial Statements as well as the Critical
Accounting Estimates section of the MD&A beginning on page41 of
the Form10-K for more information on the eects of capital market
and other reserve assumption changes on shareholders’ net income.
Information is not available for management to reasonably estimate
the future results of the GMIB business or realized investment results
due in part to interest rate and stock market volatility and other
internal and external factors. In addition, the Company is not able to
identify or reasonably estimate the nancial impact of special items
in 2012, however they will include potential adjustments associated
with HealthSpring,Inc. acquisition costs, and may include litigation
and assessment-related items.
e Company’s outlook for 2012 is subject to the factors cited above and
in the Cautionary Statement beginning on page66 of this Form10-K
and the sensitivities discussed in the Critical Accounting Estimates
section of the MD&A beginning on page41 of this Form10-K. If
unfavorable equity market and interest rate movements occur, the
Company could experience losses related to investment impairments
and the GMIB and GMDB businesses. ese losses could adversely
impact the Company’s consolidated results of operations and nancial
condition and liquidity by potentially reducing the capital of the
Company’s insurance subsidiaries and reducing their dividend-paying
capabilities.
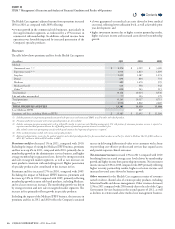
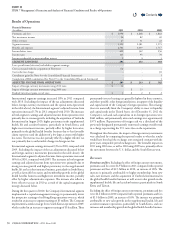
Revenues
Total revenues increased by 4% in 2011, compared with 2010, and
15% in 2010 compared with 2009. Changes in the components of
total revenue are described more fully below.
Premiums and Fees
Premiums and fees increased by 4% in 2011, compared with 2010,
primarily reecting business growth in the Company’s targeted market
segments, partially oset by the Company’s exit from the Medicare
IPFFS business beginning in 2011. Excluding this business, premiums
and fees increased by 9% in 2011 compared with 2010.
Premiums and fees increased by 15% in 2010, compared with 2009,
principally due to membership growth in the Health Care segment’s
risk businesses as well as growth in the International segment. Premiums
and fees increased by 10% in 2010 compared with 2009 after excluding
the Medicare IPFFS Individual business.
Net Investment Income
Net investment income increased by 4% in 2011, compared with 2010.
e key factors causing the increase were higher investment assets and
improved results from real estate investments, partially oset by lower
reinvestment yields.
Net investment income increased by 9% in 2010, compared with 2009,
predominantly due to improved results from security partnerships
and real estate investments and higher assets due to business growth,
partially oset by lower reinvestment yields.
Mail Order Pharmacy Revenues
Mail order pharmacy revenues increased by 2% in 2011, compared
with 2010, due in large part to price increases oset by a decline in
volume and by 11% in 2010, compared with 2009, resulting from
increases in volume and, to a lesser extent, price increases.
Other Revenues
Other revenues included pre-tax losses of $4million in 2011 compared
with $157million in 2010 and $282million in 2009 related to
futures and swaps entered into as part of a dynamic hedge program to
manage equity and growth interest rate risks in the Company’s run-o
reinsurance operations. See the Run-o Reinsurance section of the
MD&A beginning on page51 for more information on this program.
Excluding the impact of these swaps and futures contracts, Other
revenues declined 38% in 2011, compared with 2010. e decline
primarily reects the absence of revenue in 2011 from the workers’
compensation and case management business, which was sold in 2010
as well as lower revenues in 2011 from Cigna Government Services,
which was sold in the second quarter of 2011.
Excluding the impact of the futures contracts associated with the
GMDB equity hedge program, Other revenues increased 4% in
2010, compared with 2009 primarily reecting the pre-tax gain on
the sale of the workers’ compensation and case management business
of $18million.
Realized Investment Results
Realized investment results in 2011 were lower than in 2010 primarily
due to higher impairment losses on xed maturities and valuation
declines on hybrid securities, partially oset by higher gains on sales
of real estate properties held in joint ventures.
Realized investment results in 2010 were signicantly higher than in
2009 primarily due to:
•
lower impairments on xed maturities and real estate funds in 2010;
•
increased prepayment fees on xed maturities received in 2010 as
a result of favorable market conditions and issuer specic business
circumstances; and
•
gains on sales of real estate held in joint ventures and other investments
in 2010.
ese favorable eects were partially oset by an increase in commercial
mortgage loan impairments recorded in 2010, reecting continued
weakness in the commercial real estate market.
See Note14 to the Consolidated Financial Statements for additional
information.
Contents
Q