Cigna 2011 Annual Report Download - page 108
Download and view the complete annual report
Please find page 108 of the 2011 Cigna annual report below. You can navigate through the pages in the report by either clicking on the pages listed below, or by using the keyword search tool below to find specific information within the annual report.-
 1
1 -
2
-
3
-
4
-
5
-
6
-
7
-
8
-
9
-
10
-
11
-
12
-
13
-
14
-
15
-
16
-
17
-
18
-
19
-
20
-
21
-
22
-
23
-
24
-
25
-
26
-
27
-
28
-
29
-
30
-
31
-
32
-
33
-
34
-
35
-
36
-
37
-
38
-
39
-
40
-
41
-
42
-
43
-
44
-
45
-
46
-
47
-
48
-
49
-
50
-
51
-
52
-
53
-
54
-
55
-
56
-
57
-
58
-
59
-
60
-
61
-
62
-
63
-
64
-
65
-
66
-
67
-
68
-
69
-
70
-
71
-
72
-
73
-
74
-
75
-
76
-
77
-
78
-
79
-
80
-
81
-
82
-
83
-
84
-
85
-
86
-
87
-
88
-
89
-
90
-
91
-
92
-
93
-
94
-
95
-
96
-
97
-
 98
98 -
 99
99 -
 100
100 -
 101
101 -
 102
102 -
 103
103 -
 104
104 -
 105
105 -
 106
106 -
 107
107 -
 108
108 -
 109
109 -
 110
110 -
 111
111 -
 112
112 -
 113
113 -
 114
114 -
 115
115 -
 116
116 -
 117
117 -
 118
118 -
119
-
120
-
121
-
122
-
123
-
124
-
125
-
126
-
127
-
128
-
129
-
130
-
131
-
132
-
133
-
134
-
135
-
136
-
137
-
138
-
139
-
140
-
141
-
142
-
143
-
144
-
145
-
146
-
147
-
148
-
149
-
150
-
151
-
152
-
153
-
154
-
155
-
156
-
157
-
158
-
159
-
160
-
161
-
162
-
163
-
164
-
165
-
166
-
167
-
168
-
169
-
170
-
171
-
172
-
173
-
174
-
175
-
176
-
177
-
178
-
179
-
180
 |
 |

86 CIGNA CORPORATION2011 Form10K
PART II
ITEM 8 Financial Statements and Supplementary Data
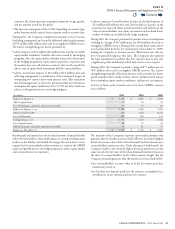
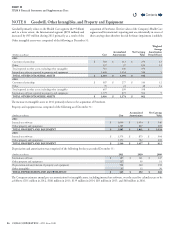
NOTE 8 Goodwill, Other Intangibles, and Property and Equipment
Goodwill primarily relates to the Health Care segment ($2.9billion)
and, to a lesser extent, the International segment ($290million) and
increased by $45million during 2011 primarily as a result of the
acquisition of FirstAssist. e fair values of the Company’s Health Care
segment and International’s reporting unit are substantially in excess of
their carrying values therefore the risk for future impairment is unlikely.
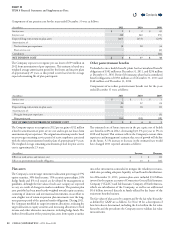
Other intangible assets were comprised of the following at December31:
(Dollars in millions)
Cost
Accumulated
Amortization
Net Carrying
Value
Weighted
Average
Amortization
Period(Years)
2011
Customer relationships $ 583 $ 313 $ 270 13
Other 127 27 100 12
Total reported in other assets, including other intangibles 710 340 370
Internal-use software reported in property and equipment 1,600 1,054 546 5
TOTAL OTHER INTANGIBLE ASSETS $ 2,310 $ 1,394 $ 916
2010
Customer relationships $ 587 $ 277 $ 310 12
Other 70 22 48 14
Total reported in other assets, including other intangibles 657 299 358
Internal-use software reported in property and equipment 1,379 875 504 5
TOTAL OTHER INTANGIBLE ASSETS $ 2,036 $ 1,174 $ 862
e increase in intangible assets in 2011 primarily relates to the acquisition of FirstAssist.
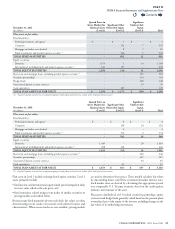
Property and equipment was comprised of the following as of December31:
(Dollars in millions)
Cost
Accumulated
Amortization
Net Carrying
Value
2011
Internal-use software $ 1,600 $ 1,054 $ 546
Other property and equipment 1,285 807 478
TOTAL PROPERTY AND EQUIPMENT $ 2,885 $ 1,861 $ 1,024
2010
Internal-use software $ 1,379 $ 875 $ 504
Other property and equipment 1,190 782 408
TOTAL PROPERTY AND EQUIPMENT $ 2,569 $ 1,657 $ 912
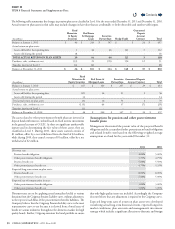
Depreciation and amortization was comprised of the following for the years ended December31:
(Dollars in millions)
2011 2010 2009
Internal-use software $ 187 $ 161 $ 147
Other property and equipment 117 99 91
Depreciation and amortization of property and equipment 304 260 238
Other intangibles 41 32 30
TOTAL DEPRECIATION AND AMORTIZATION $ 345 $ 292 $ 268
e Company estimates annual pre-tax amortization for intangible assets, including internal-use software, over the next ve calendar years to be
as follows: $231million in 2012, $186million in 2013, $139million in 2014, $83million in 2015, and $68million in 2016.
Contents
Q