Cigna 2011 Annual Report Download - page 127
Download and view the complete annual report
Please find page 127 of the 2011 Cigna annual report below. You can navigate through the pages in the report by either clicking on the pages listed below, or by using the keyword search tool below to find specific information within the annual report.-
 1
1 -
2
-
3
-
4
-
5
-
6
-
7
-
8
-
9
-
10
-
11
-
12
-
13
-
14
-
15
-
16
-
17
-
18
-
19
-
20
-
21
-
22
-
23
-
24
-
25
-
26
-
27
-
28
-
29
-
30
-
31
-
32
-
33
-
34
-
35
-
36
-
37
-
38
-
39
-
40
-
41
-
42
-
43
-
44
-
45
-
46
-
47
-
48
-
49
-
50
-
51
-
52
-
53
-
54
-
55
-
56
-
57
-
58
-
59
-
60
-
61
-
62
-
63
-
64
-
65
-
66
-
67
-
68
-
69
-
70
-
71
-
72
-
73
-
74
-
75
-
76
-
77
-
78
-
79
-
80
-
81
-
82
-
83
-
84
-
85
-
86
-
87
-
88
-
89
-
90
-
91
-
92
-
93
-
94
-
95
-
96
-
97
-
98
-
99
-
100
-
101
-
102
-
103
-
104
-
105
-
106
-
107
-
108
-
109
-
110
-
111
-
112
-
113
-
114
-
115
-
116
-
 117
117 -
 118
118 -
 119
119 -
 120
120 -
 121
121 -
 122
122 -
 123
123 -
 124
124 -
 125
125 -
 126
126 -
 127
127 -
 128
128 -
 129
129 -
 130
130 -
 131
131 -
 132
132 -
 133
133 -
 134
134 -
 135
135 -
 136
136 -
 137
137 -
138
-
139
-
140
-
141
-
142
-
143
-
144
-
145
-
146
-
147
-
148
-
149
-
150
-
151
-
152
-
153
-
154
-
155
-
156
-
157
-
158
-
159
-
160
-
161
-
162
-
163
-
164
-
165
-
166
-
167
-
168
-
169
-
170
-
171
-
172
-
173
-
174
-
175
-
176
-
177
-
178
-
179
-
180
 |
 |
105CIGNA CORPORATION2011 Form10K
PART II
ITEM 8 Financial Statements and Supplementary Data
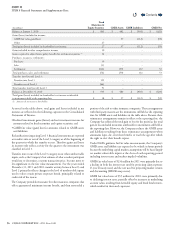
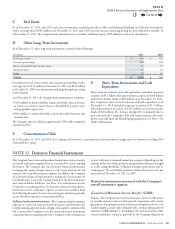
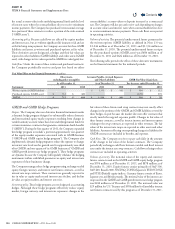
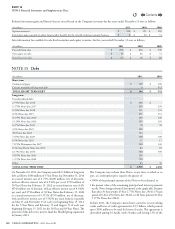
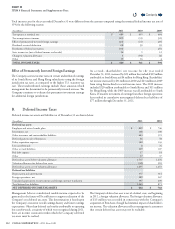
e following tables provide the eect of these derivative instruments on the nancial statements for the indicated periods:
Fair Value Eect on the Financial Statements (In millions)
Other Revenues
For the years ended December31,
2011 2010
Equity and currency futures for GMDB exposures $ (45) $ (157)
Equity and currency futures for GMIB exposures 4
TOTAL EQUITY AND CURRENCY FUTURES $41 $ 157
Other assets,
including other intangibles Other Revenues
As of December31,2011
For the year ended
December31,2011
Interest rate swaps $ 33 $ 39
Interest rate futures(1) - (2)
TOTAL INTEREST RATE SWAPS AND FUTURES $ 33 $ 37
Interest rate derivatives for GMDB exposures $ 31
Interest rate derivatives for GMIB exposures 6
TOTAL INTEREST RATE SWAPS AND FUTURES $ 37
(1) Balance sheet presentation of amounts receivable or payable relating to futures daily variation margin are not fair values and are excluded from this table.
See Notes6 and 10 for further details regarding these businesses.
Derivative instruments used in the Company’s
investment risk management
Derivative nancial instruments are also used by the Company as
a part of its investment strategy to manage the characteristics of
investment assets (such as duration, yield, currency and liquidity) to
meet the varying demands of the related insurance and contractholder
liabilities (such as paying claims, investment returns and withdrawals).
Derivatives are typically used in this strategy to minimize interest rate
and foreign currency risks.
Investment Cash Flow Hedges
Purpose. e Company uses interest rate, foreign currency, and
combination (interest rate and foreign currency) swap contracts to
hedge the interest and/or foreign currency cash ows of its xed
maturity bonds to match associated insurance liabilities.
Accounting policy. Using cash ow hedge accounting, fair values
are reported in other long-term investments or other liabilities and
accumulated other comprehensive income and amortized into net
investment income or reported in other realized investment gains and
losses as interest or principal payments are received. Net interest cash
ows are reported in operating activities.
Cash ows. Under the terms of these various contracts, the Company
periodically exchanges cash ows between variable and xed interest
rates and/or between two currencies for both principal and interest.
Foreign currency swaps are primarily Euros, Australian dollars, Canadian
dollars, Japanese yen, and British pounds, and have terms for periods
of up to 10years.
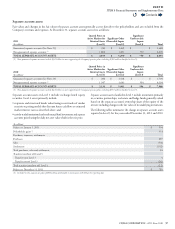
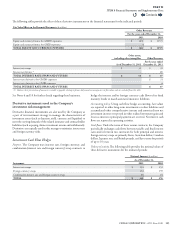
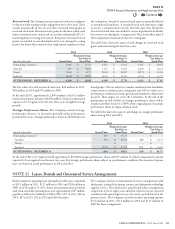
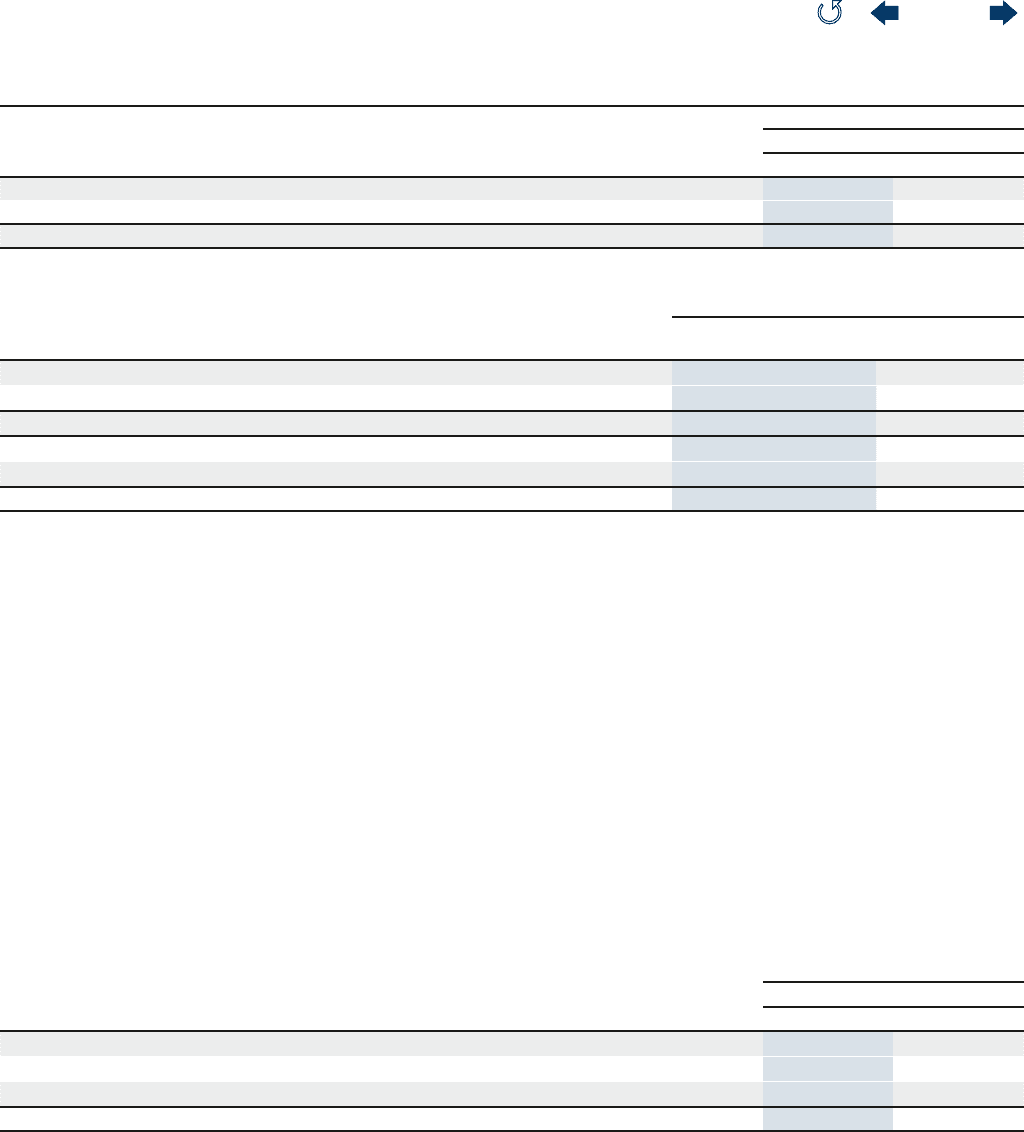
Volume of activity. e following table provides the notional values of
these derivative instruments for the indicated periods:
Instrument
Notional Amount (In millions)
As of December31,
2011 2010
Interest rate swaps $ 134 $ 153
Foreign currency swaps 134 159
Combination interest rate and foreign currency swaps 64 64
TOTAL $ 332 $ 376
Contents
Q