Cigna 2011 Annual Report Download - page 140
Download and view the complete annual report
Please find page 140 of the 2011 Cigna annual report below. You can navigate through the pages in the report by either clicking on the pages listed below, or by using the keyword search tool below to find specific information within the annual report.-
 1
1 -
2
-
3
-
4
-
5
-
6
-
7
-
8
-
9
-
10
-
11
-
12
-
13
-
14
-
15
-
16
-
17
-
18
-
19
-
20
-
21
-
22
-
23
-
24
-
25
-
26
-
27
-
28
-
29
-
30
-
31
-
32
-
33
-
34
-
35
-
36
-
37
-
38
-
39
-
40
-
41
-
42
-
43
-
44
-
45
-
46
-
47
-
48
-
49
-
50
-
51
-
52
-
53
-
54
-
55
-
56
-
57
-
58
-
59
-
60
-
61
-
62
-
63
-
64
-
65
-
66
-
67
-
68
-
69
-
70
-
71
-
72
-
73
-
74
-
75
-
76
-
77
-
78
-
79
-
80
-
81
-
82
-
83
-
84
-
85
-
86
-
87
-
88
-
89
-
90
-
91
-
92
-
93
-
94
-
95
-
96
-
97
-
98
-
99
-
100
-
101
-
102
-
103
-
104
-
105
-
106
-
107
-
108
-
109
-
110
-
111
-
112
-
113
-
114
-
115
-
116
-
117
-
118
-
119
-
120
-
121
-
122
-
123
-
124
-
125
-
126
-
127
-
128
-
129
-
 130
130 -
 131
131 -
 132
132 -
 133
133 -
 134
134 -
 135
135 -
 136
136 -
 137
137 -
 138
138 -
 139
139 -
 140
140 -
 141
141 -
 142
142 -
 143
143 -
 144
144 -
 145
145 -
 146
146 -
 147
147 -
 148
148 -
 149
149 -
 150
150 -
151
-
152
-
153
-
154
-
155
-
156
-
157
-
158
-
159
-
160
-
161
-
162
-
163
-
164
-
165
-
166
-
167
-
168
-
169
-
170
-
171
-
172
-
173
-
174
-
175
-
176
-
177
-
178
-
179
-
180
 |
 |

118 CIGNA CORPORATION2011 Form10K
PART II
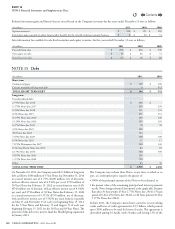
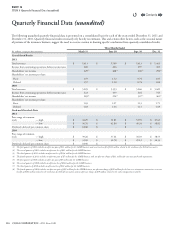
ITEM 8 Financial Statements and Supplementary Data
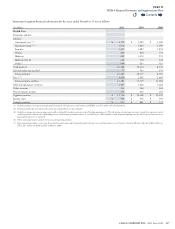
(In millions)
2011 2010 2009
Disability and Life
Premiums and fees:
Life $ 1,256 $ 1,238 $ 1,301
Disability 1,268 1,167 1,057
Other 256 262 276
Total 2,780 2,667 2,634
Other revenues - 123 113
Net investment income 267 261 244
Segment revenues $ 3,047 $ 3,051 $ 2,991
Income taxes $ 109 $ 120 $ 109
Segment earnings $ 287 $ 291 $ 284
International
Premiums and fees:
Health Care $ 1,464 $ 1,037 $ 884
Supplemental Health, Life, and Accident 1,526 1,231 998
Total 2,990 2,268 1,882
Other revenues 27 31 22
Net investment income 96 82 69
Segment revenues $ 3,113 $ 2,381 $ 1,973
Income taxes $ 125 $ 95 $ 70
Equity in income of investees $ 14 $ 14 $ 11
Segment earnings $ 286 $ 243 $ 183
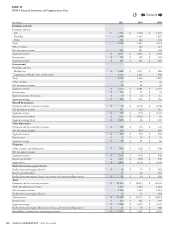
Run-o Reinsurance
Premiums and fees and other revenues $ 20 $ (133) $ (254)
Net investment income 103 114 113
Segment revenues $ 123 $ (19) $ (141)
Income taxes (benets) $ (99) $ (136) $ 93
Segment earnings (loss) $ (183) $ 26 $ 185
Other Operations
Premiums and fees and other revenues $ 169 $ 174 $ 176
Net investment income 400 404 407
Segment revenues $ 569 $ 578 $ 583
Income taxes $ 29 $ 39 $ 31
Segment earnings $ 89 $ 85 $ 86
Corporate
Other revenues and eliminations $ (58) $ (62) $ (58)
Net investment income 6 1 -
Segment revenues $ (52) $ (61) $ (58)
Income tax benets $ (101) $ (98) $ (91)
Segment loss $ (184) $ (211) $ (142)
Realized investment gains (losses)
Realized investment gains (losses) $ 62 $ 75 $ (43)
Income taxes (benets) 21 25 (17)
Realized investment gains (losses), net of taxes and noncontrolling interest $ 41 $ 50 $ (26)
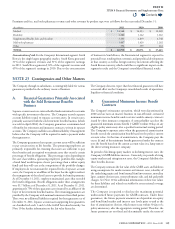
Total
Premiums and fees and other revenues $ 19,343 $ 18,653 $ 16,161
Mail order pharmacy revenues 1,447 1,420 1,282
Net investment income 1,146 1,105 1,014
Realized investment gains (losses) 62 75 (43)
Total revenues $ 21,998 $ 21,253 $ 18,414
Income taxes $ 640 $ 521 $ 594
Segment earnings $ 1,286 $ 1,295 $ 1,327
Realized investment gains (losses), net of taxes and noncontrolling interest $ 41 $ 50 $ (26)
Shareholders’ income from continuing operations $ 1,327 $ 1,345 $ 1,301
Contents
Q