Cigna 2011 Annual Report Download - page 61
Download and view the complete annual report
Please find page 61 of the 2011 Cigna annual report below. You can navigate through the pages in the report by either clicking on the pages listed below, or by using the keyword search tool below to find specific information within the annual report.-
 1
1 -
2
-
3
-
4
-
5
-
6
-
7
-
8
-
9
-
10
-
11
-
12
-
13
-
14
-
15
-
16
-
17
-
18
-
19
-
20
-
21
-
22
-
23
-
24
-
25
-
26
-
27
-
28
-
29
-
30
-
31
-
32
-
33
-
34
-
35
-
36
-
37
-
38
-
39
-
40
-
41
-
42
-
43
-
44
-
45
-
46
-
47
-
48
-
49
-
50
-
 51
51 -
 52
52 -
 53
53 -
 54
54 -
 55
55 -
 56
56 -
 57
57 -
 58
58 -
 59
59 -
 60
60 -
 61
61 -
 62
62 -
 63
63 -
 64
64 -
 65
65 -
 66
66 -
 67
67 -
 68
68 -
 69
69 -
 70
70 -
 71
71 -
72
-
73
-
74
-
75
-
76
-
77
-
78
-
79
-
80
-
81
-
82
-
83
-
84
-
85
-
86
-
87
-
88
-
89
-
90
-
91
-
92
-
93
-
94
-
95
-
96
-
97
-
98
-
99
-
100
-
101
-
102
-
103
-
104
-
105
-
106
-
107
-
108
-
109
-
110
-
111
-
112
-
113
-
114
-
115
-
116
-
117
-
118
-
119
-
120
-
121
-
122
-
123
-
124
-
125
-
126
-
127
-
128
-
129
-
130
-
131
-
132
-
133
-
134
-
135
-
136
-
137
-
138
-
139
-
140
-
141
-
142
-
143
-
144
-
145
-
146
-
147
-
148
-
149
-
150
-
151
-
152
-
153
-
154
-
155
-
156
-
157
-
158
-
159
-
160
-
161
-
162
-
163
-
164
-
165
-
166
-
167
-
168
-
169
-
170
-
171
-
172
-
173
-
174
-
175
-
176
-
177
-
178
-
179
-
180
 |
 |
39CIGNA CORPORATION2011 Form10K
PART II
ITEM 7 Management’s Discussion and Analysis of Financial Condition and Results of Operations
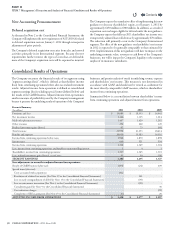
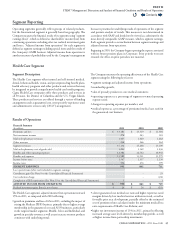
Summarized below is adjusted income from operations by segment:
Adjusted Income (Loss) From Operations
(In millions)
2011 2010 2009
Health Care $ 990 $ 861 $ 729
Disability and Life 282 291 279
International 289 243 182
Run-o Reinsurance (48) (27) (24)
Other Operations 85 85 85
Corporate (170) (176) (154)
TOTAL $ 1,428 $ 1,277 $ 1,097
Overview of 2011 Consolidated Results
of Operations
Shareholders’ income from continuing operations decreased 1% in
2011 compared with 2010, due to signicantly higher GMIB losses
principally reecting lower interest rates, substantially oset by higher
adjusted income from operations as explained further below. See the
Run-o Reinsurance section of the MD&A beginning on page51 for
additional information on GMIB results.
Adjusted income from operations increased 12% in 2011 compared
with 2010 primarily due to higher earnings contributions from the
Company’s Health Care and International segments. ese results
reect solid business growth in strategically targeted markets and
continued low medical services utilization trend. See the individual
segment sections of this MD&A for further discussion.
Overview of 2010 Consolidated Results
of Operations
Shareholders’ income from continuing operations increased 3% in
2010 compared with 2009, reecting strong growth in adjusted
income from operations as well as signicant improvement in realized
investment results, partially oset by a loss in the GMIB business in
2010 compared with a signicant gain in 2009.
Adjusted income from operations increased 16% in 2010 compared
with 2009 primarily due to strong earnings growth in the ongoing
business segments (Health Care, Disability and Life and International),
reecting focused execution of the Company’s strategy, which includes
a growing global customer base as well as higher net investment income
reecting improved economic conditions and asset growth.
Special Items and GMIB
Management does not believe that the special items noted in the
table above are representative of the Company’s underlying results
ofoperations. Accordingly, the Company excluded these special
items from adjusted income from operations in order to facilitate an
understanding and comparison of results of operations and permit
analysis of trends in underlying revenue, expenses and shareholders’
income from continuing operations.
Special items for 2011 included:
•
after-tax costs incurred in the fourth quarter of 2011 associated with
the January2012 acquisition of HealthSpring and the November2011
acquisition of FirstAssist; and
•
tax benets associated with the completion of the 2007 and 2008 IRS
examinations (see Note19 to the Consolidated Financial Statements
for additional information regarding this special item).
Special items for 2010 included:
•
a gain resulting from the resolution of a federal income tax matter,
consisting of a $97million release of a deferred tax valuation allowance
and $4million of accrued interest. See Note19 to the Consolidated
Financial Statements for further information;
•
a loss on the extinguishment of debt resulting from the decision of
certain holders of the Company’s 8.5% Notesdue 2019 and 6.35%
Notesdue 2018 to accept the Company’s tender oer to redeem these
Notesfor cash. See Note15 to the Consolidated Financial Statements
for further information; and
•
a loss on reinsurance of the run-o workers’ compensation and
personal accident reinsurance businesses to Enstar. See Note3 to the
Consolidated Financial Statements for further information.
Special items for 2009 included a curtailment gain resulting from the
decision to freeze the pension plan (see Note9 to the Consolidated
Financial Statements for additional information), cost reduction charges
related to the 2008 cost reduction program, and benets resulting from
the completion of the 2005 and 2006 IRS examinations (see Note19
to the Consolidated Financial Statements for additional information).
e Company also excludes the results of the GMIB business, including
the results of the related hedges starting in 2011, from adjusted income
from operations because the fair value of GMIB assets and liabilities
must be recalculated each quarter using updated capital market
assumptions. e resulting changes in fair value, which are reported
in shareholders’ net income, are volatile and unpredictable. See the
Critical Accounting Estimates section of the MD&A beginning on
page41 of the Company’s 2011 Form10-K for more information on
the eects of capital market assumption changes on shareholders’ net
income. Because of this volatility, and since the GMIB business is in
run-o, management does not believe that its results are meaningful
in assessing underlying results of operations.
Outlook for 2012
e Company expects 2012 consolidated adjusted income from
operations to be higher than 2011 results. is outlook reects strong
organic growth, an expected increase in medical services utilization
and contributions from the HealthSpring acquisition. is outlook
assumes break-even results for GMDB (also known as “VADBe”) for
2012, which assumes that actual experience, including capital market
Contents
Q