Cigna 2011 Annual Report Download - page 82
Download and view the complete annual report
Please find page 82 of the 2011 Cigna annual report below. You can navigate through the pages in the report by either clicking on the pages listed below, or by using the keyword search tool below to find specific information within the annual report.-
 1
1 -
2
-
3
-
4
-
5
-
6
-
7
-
8
-
9
-
10
-
11
-
12
-
13
-
14
-
15
-
16
-
17
-
18
-
19
-
20
-
21
-
22
-
23
-
24
-
25
-
26
-
27
-
28
-
29
-
30
-
31
-
32
-
33
-
34
-
35
-
36
-
37
-
38
-
39
-
40
-
41
-
42
-
43
-
44
-
45
-
46
-
47
-
48
-
49
-
50
-
51
-
52
-
53
-
54
-
55
-
56
-
57
-
58
-
59
-
60
-
61
-
62
-
63
-
64
-
65
-
66
-
67
-
68
-
69
-
70
-
71
-
 72
72 -
 73
73 -
 74
74 -
 75
75 -
 76
76 -
 77
77 -
 78
78 -
 79
79 -
 80
80 -
 81
81 -
 82
82 -
 83
83 -
 84
84 -
 85
85 -
 86
86 -
 87
87 -
 88
88 -
 89
89 -
 90
90 -
 91
91 -
 92
92 -
93
-
94
-
95
-
96
-
97
-
98
-
99
-
100
-
101
-
102
-
103
-
104
-
105
-
106
-
107
-
108
-
109
-
110
-
111
-
112
-
113
-
114
-
115
-
116
-
117
-
118
-
119
-
120
-
121
-
122
-
123
-
124
-
125
-
126
-
127
-
128
-
129
-
130
-
131
-
132
-
133
-
134
-
135
-
136
-
137
-
138
-
139
-
140
-
141
-
142
-
143
-
144
-
145
-
146
-
147
-
148
-
149
-
150
-
151
-
152
-
153
-
154
-
155
-
156
-
157
-
158
-
159
-
160
-
161
-
162
-
163
-
164
-
165
-
166
-
167
-
168
-
169
-
170
-
171
-
172
-
173
-
174
-
175
-
176
-
177
-
178
-
179
-
180
 |
 |
60 CIGNA CORPORATION2011 Form10K
PART II
ITEM 7 Management’s Discussion and Analysis of Financial Condition and Results of Operations
Consolidated Financial Statements for further information on pension
and other postretirement benet obligations).
e above table also does not contain $52million of gross liabilities
for uncertain tax positions because the Company cannot reasonably
estimate the timing of their resolution with the respective taxing
authorities. See Note19 to the Consolidated Financial Statements
for the year ended December31,2011 for further information.
Off-Balance Sheet:
•
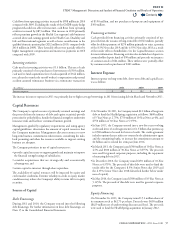
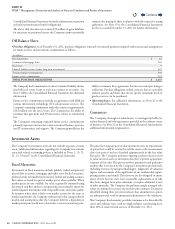
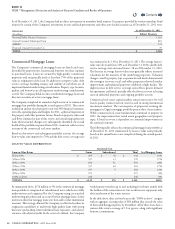
Purchase obligations. As of December31,2011, purchase obligations consisted of estimated payments required under contractual arrangements
for future services and investment commitments as follows:
(In millions)
Fixed maturities $ 16
Commercial mortgage loans 162
Real estate 9
Limited liability entities (other long-term investments) 407
Total investment commitments 594
Future service commitments 523
TOTAL PURCHASE OBLIGATIONS $ 1,117
e Company had commitments to invest in limited liability entities
that hold real estate, loans to real estate entities or securities. See
Note11(D) to the Consolidated Financial Statements for additional
information.
Future service commitments include an agreement with IBM for
various information technology (IT) infrastructure services. e
Company’s remaining commitment under this contract is approximately
$162million over the next 2 years. e Company has the ability to
terminate this agreement with 90days notice, subject to termination
fees.
e Company’s remaining estimated future service commitments
primarily represent contracts for certain outsourced business processes
and IT maintenance and support. e Company generally has the
ability to terminate these agreements, but does not anticipate doing so
at this time. Purchase obligations exclude contracts that are cancelable
without penalty and those that do not specify minimum levels of
goods or services to be purchased.
•
Operating leases. For additional information, see Note21 to the
Consolidated Financial Statements.
Guarantees
e Company, through its subsidiaries, is contingently liable for
various nancial and other guarantees provided in the ordinary course
of business. See Note23 to the Consolidated Financial Statements for
additional information on guarantees.
Investment Assets
e Company’s investment assets do not include separate account
assets. Additional information regarding the Company’s investment
assets and related accounting policies is included in Notes2, 10, 11,
12, 13, 14 and 17 to the Consolidated Financial Statements.
Fixed Maturities
Investments in xed maturities include publicly traded and privately
placed debt securities, mortgage and other asset-backed securities,
preferred stocks redeemable by the investor, hybrid and trading securities.
Fair values are based on quoted market prices when available. When
market prices are not available, fair value is generally estimated using
discounted cash ow analyses, incorporating current market inputs for
similar nancial instruments with comparable terms and credit quality.
In instances where there is little or no market activity for the same or
similar instruments, the Company estimates fair value using methods,
models and assumptions that the Company believes a hypothetical
market participant would use to determine a current transaction price.
e prices the Company used to value investment assets are representative
of prices that would be received to sell the assets at the measurement
date (exit prices) and are classied appropriately in the fair value
hierarchy. e Company performs ongoing analyses of prices used
to value invested assets to determine that they represent appropriate
estimates of fair value. is process involves quantitative and qualitative
analysis that is overseen by the Company’s investment professionals,
including reviews of pricing methodologies, judgments of valuation
inputs, and assessments of the signicance of any unobservable inputs,
pricing statistics and trends. ese reviews are also designed to ensure
prices do not become stale, have reasonable explanations as to why
they have changed from prior valuations, or require additional review
of other anomalies. e Company also performs sample testing of sales
values to conrm the accuracy of prior fair value estimates. Exceptions
identied during these processes indicate that adjustments to prices
are infrequent and result in immaterial adjustments to the valuations.
e Company’s xed maturity portfolio continues to be diversied by
issuer and industry type, with no single industry constituting more
than 10% of total invested assets as of December31,2011.
Contents
Q