Cigna 2011 Annual Report Download - page 111
Download and view the complete annual report
Please find page 111 of the 2011 Cigna annual report below. You can navigate through the pages in the report by either clicking on the pages listed below, or by using the keyword search tool below to find specific information within the annual report.-
 1
1 -
2
-
3
-
4
-
5
-
6
-
7
-
8
-
9
-
10
-
11
-
12
-
13
-
14
-
15
-
16
-
17
-
18
-
19
-
20
-
21
-
22
-
23
-
24
-
25
-
26
-
27
-
28
-
29
-
30
-
31
-
32
-
33
-
34
-
35
-
36
-
37
-
38
-
39
-
40
-
41
-
42
-
43
-
44
-
45
-
46
-
47
-
48
-
49
-
50
-
51
-
52
-
53
-
54
-
55
-
56
-
57
-
58
-
59
-
60
-
61
-
62
-
63
-
64
-
65
-
66
-
67
-
68
-
69
-
70
-
71
-
72
-
73
-
74
-
75
-
76
-
77
-
78
-
79
-
80
-
81
-
82
-
83
-
84
-
85
-
86
-
87
-
88
-
89
-
90
-
91
-
92
-
93
-
94
-
95
-
96
-
97
-
98
-
99
-
100
-
 101
101 -
 102
102 -
 103
103 -
 104
104 -
 105
105 -
 106
106 -
 107
107 -
 108
108 -
 109
109 -
 110
110 -
 111
111 -
 112
112 -
 113
113 -
 114
114 -
 115
115 -
 116
116 -
 117
117 -
 118
118 -
 119
119 -
 120
120 -
 121
121 -
122
-
123
-
124
-
125
-
126
-
127
-
128
-
129
-
130
-
131
-
132
-
133
-
134
-
135
-
136
-
137
-
138
-
139
-
140
-
141
-
142
-
143
-
144
-
145
-
146
-
147
-
148
-
149
-
150
-
151
-
152
-
153
-
154
-
155
-
156
-
157
-
158
-
159
-
160
-
161
-
162
-
163
-
164
-
165
-
166
-
167
-
168
-
169
-
170
-
171
-
172
-
173
-
174
-
175
-
176
-
177
-
178
-
179
-
180
 |
 |

89CIGNA CORPORATION2011 Form10K
PART II
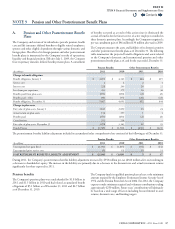
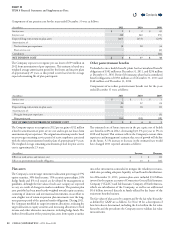
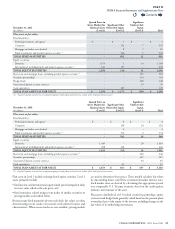
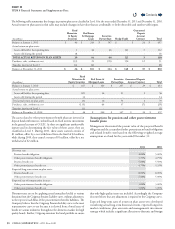
ITEM 8 Financial Statements and Supplementary Data
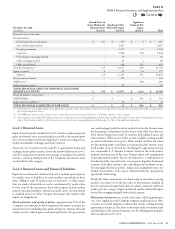
December31,2011
(In millions)
Quoted Prices in
Active Markets for
Identical Assets
(Level1)
Signicant Other
Observable Inputs
(Level2)
Signicant
Unobservable
Inputs
(Level3) Total
Plan assets at fair value:
Fixed maturities:
Federal government and agency $ - $ 5 $ - $ 5
Corporate - 332 7 339
Mortgage and other asset-backed - 8 2 10
Fund investments and pooled separate accounts(1) - 546 3 549
TOTAL FIXED MATURITIES 891 12 903
Equity securities:
Domestic 1,153 1 14 1,168
International, including funds and pooled separate accounts(1) 141 137 - 278
TOTAL EQUITY SECURITIES 1,294 138 14 1,446
Real estate and mortgage loans, including pooled separate accounts(1) - - 303 303
Securities partnerships - - 314 314
Hedge funds - - 148 148
Guaranteed deposit account contract - - 39 39
Cash equivalents - 145 - 145
TOTAL PLAN ASSETS AT FAIR VALUE $ 1,294 $ 1,174 $ 830 $ 3,298
(1) A pooled separate account has several participating benefit plans and each owns a share of the total pool of investments.
December31,2010
(In millions)
Quoted Prices in
Active Markets for
Identical Assets
(Level1)
Signicant Other
Observable Inputs
(Level2)
Signicant
Unobservable
Inputs
(Level3) Total
Plan assets at fair value:
Fixed maturities:
Federal government and agency $ - $ 8 $ - $ 8
Corporate - 158 24 182
Mortgage and other asset-backed - 4 - 4
Fund investments and pooled separate accounts(1) - 372 2 374
TOTAL FIXED MATURITIES 542 26 568
Equity securities:
Domestic 1,445 - 20 1,465
International, including funds and pooled separate accounts(1) 208 218 - 426
TOTAL EQUITY SECURITIES 1,653 218 20 1,891
Real estate and mortgage loans, including pooled separate accounts(1) - - 240 240
Securities partnerships - - 347 347
Guaranteed deposit account contract - - 24 24
Cash equivalents - 93 - 93
TOTAL PLAN ASSETS AT FAIR VALUE $ 1,653 $ 853 $ 657 $ 3,163
(1) A pooled separate account has several participating benefit plans and each owns a share of the total pool of investments.
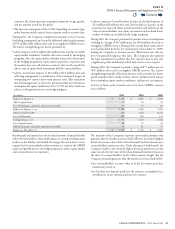
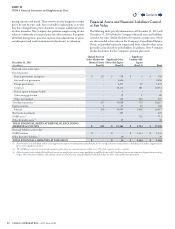
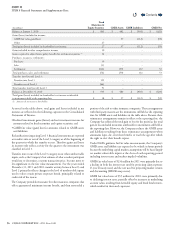
Plan assets in Level1 include exchange-listed equity securities. Level2
assets primarily include:
•
xed income and international equity funds priced using their daily
net asset value which is the exit price; and
•
xed maturities valued using recent trades of similar securities or
pricing models as described below.
Because many xed maturities do not trade daily, fair values are often
derived using recent trades of securities with similar features and
characteristics. When recent trades are not available, pricing models
are used to determine these prices. ese models calculate fair values
by discounting future cash ows at estimated market interest rates.
Such market rates are derived by calculating the appropriate spreads
over comparable U.S. Treasury securities, based on the credit quality,
industry and structure of the asset.
Plan assets classied in Level3 include securities partnerships, equity
real estate and hedge funds generally valued based on the pension plan’s
ownership share of the equity of the investee including changes in the
fair values of its underlying investments.
Contents
Q