Cigna 2011 Annual Report Download - page 169
Download and view the complete annual report
Please find page 169 of the 2011 Cigna annual report below. You can navigate through the pages in the report by either clicking on the pages listed below, or by using the keyword search tool below to find specific information within the annual report.-
 1
1 -
2
-
3
-
4
-
5
-
6
-
7
-
8
-
9
-
10
-
11
-
12
-
13
-
14
-
15
-
16
-
17
-
18
-
19
-
20
-
21
-
22
-
23
-
24
-
25
-
26
-
27
-
28
-
29
-
30
-
31
-
32
-
33
-
34
-
35
-
36
-
37
-
38
-
39
-
40
-
41
-
42
-
43
-
44
-
45
-
46
-
47
-
48
-
49
-
50
-
51
-
52
-
53
-
54
-
55
-
56
-
57
-
58
-
59
-
60
-
61
-
62
-
63
-
64
-
65
-
66
-
67
-
68
-
69
-
70
-
71
-
72
-
73
-
74
-
75
-
76
-
77
-
78
-
79
-
80
-
81
-
82
-
83
-
84
-
85
-
86
-
87
-
88
-
89
-
90
-
91
-
92
-
93
-
94
-
95
-
96
-
97
-
98
-
99
-
100
-
101
-
102
-
103
-
104
-
105
-
106
-
107
-
108
-
109
-
110
-
111
-
112
-
113
-
114
-
115
-
116
-
117
-
118
-
119
-
120
-
121
-
122
-
123
-
124
-
125
-
126
-
127
-
128
-
129
-
130
-
131
-
132
-
133
-
134
-
135
-
136
-
137
-
138
-
139
-
140
-
141
-
142
-
143
-
144
-
145
-
146
-
147
-
148
-
149
-
150
-
151
-
152
-
153
-
154
-
155
-
156
-
157
-
158
-
 159
159 -
 160
160 -
 161
161 -
 162
162 -
 163
163 -
 164
164 -
 165
165 -
 166
166 -
 167
167 -
 168
168 -
 169
169 -
 170
170 -
 171
171 -
 172
172 -
 173
173 -
 174
174 -
 175
175 -
 176
176 -
 177
177 -
 178
178 -
 179
179 -
180
 |
 |
PART IV
E-4CIGNA CORPORATION2011 Form10K
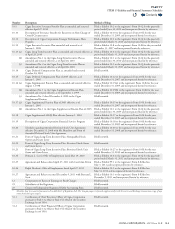
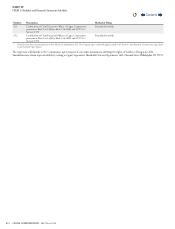
ITEM 15 Exhibits and Financial Statement Schedules
PART IV Schedules
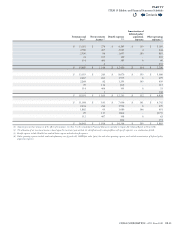
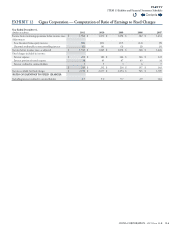
EXHIBIT 12 Cigna Corporation — Computation of Ratio of Earnings to Fixed Charges
Year Ended December31,
(Dollars in millions)
2011 2010 2009 2008 2007
Income from continuing operations before income taxes $ 1,968 $ 1,870 $ 1,898 $ 382 $ 1,634
Adjustments:
Loss (income) from equity investee (22) (21) (17) (12) (5)
(Income) attributable to noncontrolling interest (1) (4) (3) (2) (3)
Income before income taxes, as adjusted $ 1,945 $ 1,845 $ 1,878 $ 368 $ 1,626
Fixed charges included in income:
Interest expense $ 202 $ 182 $ 166 $ 146 $ 122
Interest portion of rental expense 38 45 47 45 34
Interest credited to contractholders 5 5 3 6 7
$ 245 $ 232 $ 216 $ 197 $ 163
Income available for xed charges $ 2,190 $ 2,077 $ 2,094 $ 565 $ 1,789
RATIO OF EARNINGS TO FIXED CHARGES:
Including interest credited to contractholders 8.9 9.0 9.7 2.9 11.0
Contents
Q