Cigna 2011 Annual Report Download - page 157
Download and view the complete annual report
Please find page 157 of the 2011 Cigna annual report below. You can navigate through the pages in the report by either clicking on the pages listed below, or by using the keyword search tool below to find specific information within the annual report.-
 1
1 -
2
-
3
-
4
-
5
-
6
-
7
-
8
-
9
-
10
-
11
-
12
-
13
-
14
-
15
-
16
-
17
-
18
-
19
-
20
-
21
-
22
-
23
-
24
-
25
-
26
-
27
-
28
-
29
-
30
-
31
-
32
-
33
-
34
-
35
-
36
-
37
-
38
-
39
-
40
-
41
-
42
-
43
-
44
-
45
-
46
-
47
-
48
-
49
-
50
-
51
-
52
-
53
-
54
-
55
-
56
-
57
-
58
-
59
-
60
-
61
-
62
-
63
-
64
-
65
-
66
-
67
-
68
-
69
-
70
-
71
-
72
-
73
-
74
-
75
-
76
-
77
-
78
-
79
-
80
-
81
-
82
-
83
-
84
-
85
-
86
-
87
-
88
-
89
-
90
-
91
-
92
-
93
-
94
-
95
-
96
-
97
-
98
-
99
-
100
-
101
-
102
-
103
-
104
-
105
-
106
-
107
-
108
-
109
-
110
-
111
-
112
-
113
-
114
-
115
-
116
-
117
-
118
-
119
-
120
-
121
-
122
-
123
-
124
-
125
-
126
-
127
-
128
-
129
-
130
-
131
-
132
-
133
-
134
-
135
-
136
-
137
-
138
-
139
-
140
-
141
-
142
-
143
-
144
-
145
-
146
-
 147
147 -
 148
148 -
 149
149 -
 150
150 -
 151
151 -
 152
152 -
 153
153 -
 154
154 -
 155
155 -
 156
156 -
 157
157 -
 158
158 -
 159
159 -
 160
160 -
 161
161 -
 162
162 -
 163
163 -
 164
164 -
 165
165 -
 166
166 -
 167
167 -
168
-
169
-
170
-
171
-
172
-
173
-
174
-
175
-
176
-
177
-
178
-
179
-
180
 |
 |
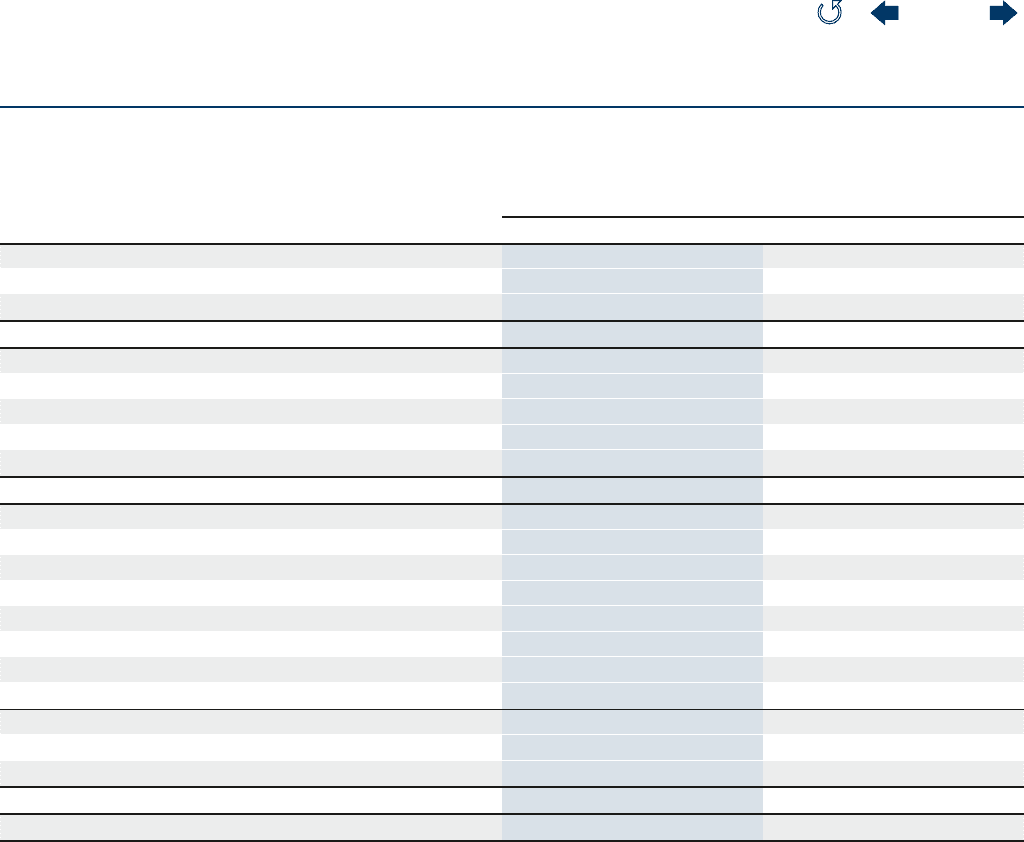
FS-5CIGNA CORPORATION2011 Form10K
ITEM 15 Exhibits and Financial Statement Schedules
PART IV
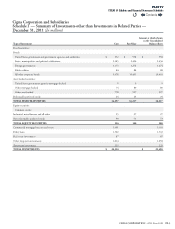
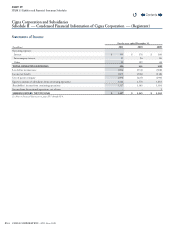
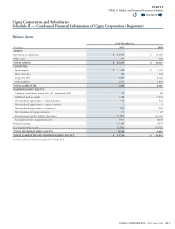
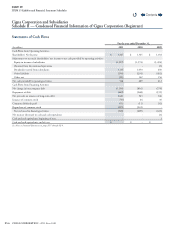
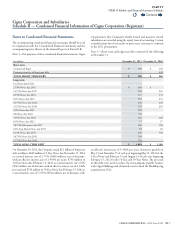
Cigna Corporation and Subsidiaries
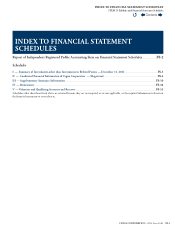
Schedule II — Condensed Financial Information of Cigna Corporation (Registrant)
Balance sheets
(In millions)
As of December31,
2011 2010
ASSETS:
Investments in subsidiaries $ 14,956 $ 14,384
Other assets 793 568
TOTAL ASSETS $ 15,749 $ 14,952
LIABILITIES:
Intercompany $ 460 $ 3,718
Short-term debt 100 548
Long-term debt 4,869 2,180
Other liabilities 1,976 1,861
TOTAL LIABILITIES 7,405 8,307
SHAREHOLDERS’ EQUITY:
Common stock (shares issued, 366; 351; authorized, 600) 92 88
Additional paid-in capital 3,188 2,534
Net unrealized appreciation— xed maturities 739 529
Net unrealized appreciation— equity securities 1 3
Net unrealized depreciation— derivatives (23) (24)
Net translation of foreign currencies (3) 25
Postretirement benets liability adjustment (1,507) (1,147)
Accumulated other comprehensive loss (793) (614)
Retained earnings 11,143 9,879
Less treasury stock, at cost (5,286) (5,242)
TOTAL SHAREHOLDERS’ EQUITY 8,344 6,645
TOTAL LIABILITIES AND SHAREHOLDERS’ EQUITY $ 15,749 $ 14,952
See Notesto Financial Statements on pages FS-7 through FS-9.
Contents
Q