Cigna 2011 Annual Report Download - page 139
Download and view the complete annual report
Please find page 139 of the 2011 Cigna annual report below. You can navigate through the pages in the report by either clicking on the pages listed below, or by using the keyword search tool below to find specific information within the annual report.-
 1
1 -
2
-
3
-
4
-
5
-
6
-
7
-
8
-
9
-
10
-
11
-
12
-
13
-
14
-
15
-
16
-
17
-
18
-
19
-
20
-
21
-
22
-
23
-
24
-
25
-
26
-
27
-
28
-
29
-
30
-
31
-
32
-
33
-
34
-
35
-
36
-
37
-
38
-
39
-
40
-
41
-
42
-
43
-
44
-
45
-
46
-
47
-
48
-
49
-
50
-
51
-
52
-
53
-
54
-
55
-
56
-
57
-
58
-
59
-
60
-
61
-
62
-
63
-
64
-
65
-
66
-
67
-
68
-
69
-
70
-
71
-
72
-
73
-
74
-
75
-
76
-
77
-
78
-
79
-
80
-
81
-
82
-
83
-
84
-
85
-
86
-
87
-
88
-
89
-
90
-
91
-
92
-
93
-
94
-
95
-
96
-
97
-
98
-
99
-
100
-
101
-
102
-
103
-
104
-
105
-
106
-
107
-
108
-
109
-
110
-
111
-
112
-
113
-
114
-
115
-
116
-
117
-
118
-
119
-
120
-
121
-
122
-
123
-
124
-
125
-
126
-
127
-
128
-
 129
129 -
 130
130 -
 131
131 -
 132
132 -
 133
133 -
 134
134 -
 135
135 -
 136
136 -
 137
137 -
 138
138 -
 139
139 -
 140
140 -
 141
141 -
 142
142 -
 143
143 -
 144
144 -
 145
145 -
 146
146 -
 147
147 -
 148
148 -
 149
149 -
150
-
151
-
152
-
153
-
154
-
155
-
156
-
157
-
158
-
159
-
160
-
161
-
162
-
163
-
164
-
165
-
166
-
167
-
168
-
169
-
170
-
171
-
172
-
173
-
174
-
175
-
176
-
177
-
178
-
179
-
180
 |
 |

117CIGNA CORPORATION2011 Form10K
PART II
ITEM 8 Financial Statements and Supplementary Data
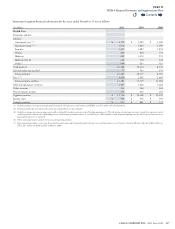
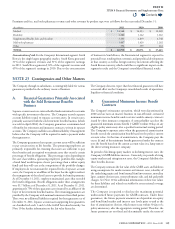
Summarized segment nancial information for the years ended December31 was as follows:
(In millions)
2011 2010 2009
Health Care
Premiums and fees:
Medical:
Guaranteed cost(1)(2) $ 4,176 $ 3,929 $ 3,380
Experience-rated(2)(3) 1,934 1,823 1,699
Stop loss 1,451 1,287 1,274
Dental 894 804 731
Medicare 489 1,470 595
Medicare PartD 624 558 342
Other (4) 600 543 515
Total medical 10,168 10,414 8,536
Life and other non-medical 77 103 179
Total premiums 10,245 10,517 8,715
Fees(2)(5) 2,936 2,802 2,669
Total premiums and fees 13,181 13,319 11,384
Mail order pharmacy revenues 1,447 1,420 1,282
Other revenues 234 266 262
Net investment income 274 243 181
Segment revenues $ 15,136 $ 15,248 $ 13,109
Income taxes $ 556 $ 476 $ 399
Segment earnings $ 991 $ 861 $ 731
(1) Includes guaranteed cost premiums primarily associated with open access and commercial HMO, as well as other risk-related products.
(2) Premiums and/or fees associated with certain specialty products are also included.
(3) Includes minimum premium arrangements with a risk profile similar to experience-rated funding arrangements. The risk portion of minimum revenue is reported in experience-rated
medical premium whereas the self funding portion of minimum premium revenue is recorded in fees. Also includes certain non-participating cases for which special customer level
reporting of experience is required.
(4) Other medical premiums include risk revenue for specialty products.
(5) Represents administrative service fees for medical members and related specialty product fees for non-medical members as well as fees related to Medicare PartD of $61million in
2011, $57million in 2010 and $41million in 2009.
Contents
Q