Cigna 2011 Annual Report Download - page 77
Download and view the complete annual report
Please find page 77 of the 2011 Cigna annual report below. You can navigate through the pages in the report by either clicking on the pages listed below, or by using the keyword search tool below to find specific information within the annual report.-
 1
1 -
2
-
3
-
4
-
5
-
6
-
7
-
8
-
9
-
10
-
11
-
12
-
13
-
14
-
15
-
16
-
17
-
18
-
19
-
20
-
21
-
22
-
23
-
24
-
25
-
26
-
27
-
28
-
29
-
30
-
31
-
32
-
33
-
34
-
35
-
36
-
37
-
38
-
39
-
40
-
41
-
42
-
43
-
44
-
45
-
46
-
47
-
48
-
49
-
50
-
51
-
52
-
53
-
54
-
55
-
56
-
57
-
58
-
59
-
60
-
61
-
62
-
63
-
64
-
65
-
66
-
 67
67 -
 68
68 -
 69
69 -
 70
70 -
 71
71 -
 72
72 -
 73
73 -
 74
74 -
 75
75 -
 76
76 -
 77
77 -
 78
78 -
 79
79 -
 80
80 -
 81
81 -
 82
82 -
 83
83 -
 84
84 -
 85
85 -
 86
86 -
 87
87 -
88
-
89
-
90
-
91
-
92
-
93
-
94
-
95
-
96
-
97
-
98
-
99
-
100
-
101
-
102
-
103
-
104
-
105
-
106
-
107
-
108
-
109
-
110
-
111
-
112
-
113
-
114
-
115
-
116
-
117
-
118
-
119
-
120
-
121
-
122
-
123
-
124
-
125
-
126
-
127
-
128
-
129
-
130
-
131
-
132
-
133
-
134
-
135
-
136
-
137
-
138
-
139
-
140
-
141
-
142
-
143
-
144
-
145
-
146
-
147
-
148
-
149
-
150
-
151
-
152
-
153
-
154
-
155
-
156
-
157
-
158
-
159
-
160
-
161
-
162
-
163
-
164
-
165
-
166
-
167
-
168
-
169
-
170
-
171
-
172
-
173
-
174
-
175
-
176
-
177
-
178
-
179
-
180
 |
 |

55CIGNA CORPORATION2011 Form10K
PART II
ITEM 7 Management’s Discussion and Analysis of Financial Condition and Results of Operations
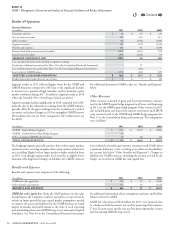
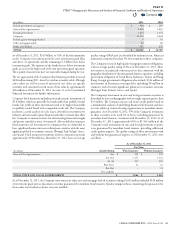
Financial Summary
(In millions)
2011 2010 2009
SEGMENT LOSS $ (184) $ (211) $ (142)
Less: special items (after-tax) included in segment loss:
Cost associated with HealthSpring acquisition (28) - -
Resolution of Federal Tax Matter (See Note19 to the Consolidated Financial Statements) - 4 -
Loss on early extinguishment of debt (See Note15 to the Consolidated Financial Statements) - (39) -
Completion of IRS examination (See Note19 to the Consolidated Financial Statements) 14 - 12
ADJUSTED LOSS FROM OPERATIONS $ 170 $ 176 $ 154
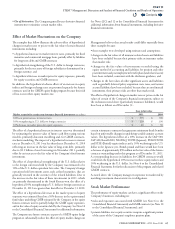
Corporate’s segment loss was lower in 2011 compared with 2010
primarily reecting a tax benet from completing the IRS examination
and absence of the 2010 loss on debt extinguishment, partially oset
by costs associated with the HealthSpring acquisition, all of which
were reported as special items.
Corporate’s adjusted loss from operations was lower in 2011 compared
with 2010 primarily reecting decreased pension expense and lower
tax adjustments related to postretirement benets and compensation
resulting from Health Care Reform. ese factors were partially oset
by increased net interest expense due to higher average borrowings
outstanding in 2011.
Corporate’s segment loss and adjusted loss from operations were higher
in 2010 compared with 2009 primarily reecting:
•
higher net interest expense, primarily driven by a higher long-term
debt balance;
•
tax adjustments related to postretirement benets and compensation
resulting from health care reform;
•
pension expense related to the Company’s frozen pension plans which
was reported in Corporate beginning in 2010; and
•
for the segment loss, the after-tax loss on early extinguishment of
debt of $39million.
ese unfavorable eects were partially oset by lower spending on
strategic initiatives and lower directors’ deferred compensation expense.
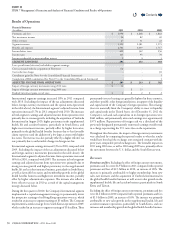
Liquidity and Capital Resources
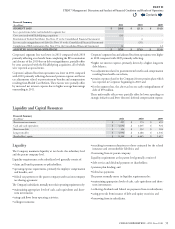
Financial Summary
(In millions)
2011 2010 2009
Short-term investments $ 225 $ 174 $ 493
Cash and cash equivalents $ 4,690 $ 1,605 $ 924
Short-term debt $ 104 $ 552 $ 104
Long-term debt $ 4,990 $ 2,288 $ 2,436
Shareholders’ equity $ 8,344 $ 6,645 $ 5,417
Liquidity
e Company maintains liquidity at two levels: the subsidiary level
and the parent company level.
Liquidity requirements at the subsidiary level generally consist of:
•claim and benet payments to policyholders;
•
operating expense requirements, primarily for employee compensation
and benets; and
•
federal tax payments to the parent company under an intercompany
tax sharing agreement.
e Company’s subsidiaries normally meet their operating requirements by:
•
maintaining appropriate levels of cash, cash equivalents and short-
terminvestments;
•using cash ows from operating activities;
•selling investments;
•
matching investment durations to those estimated for the related
insurance and contractholder liabilities; and
•borrowing from its parent company.
Liquidity requirements at the parent level generally consist of:
•debt service and dividend payments to shareholders;
•pension plan funding; and
•federal tax payments.
e parent normally meets its liquidity requirements by:
•
maintaining appropriate levels of cash, cash equivalents and short-
terminvestments;
•collecting dividends and federal tax payments from its subsidiaries;
•using proceeds from issuance of debt and equity securities; and
•borrowing from its subsidiaries.
Contents
Q