Cigna 2011 Annual Report Download - page 102
Download and view the complete annual report
Please find page 102 of the 2011 Cigna annual report below. You can navigate through the pages in the report by either clicking on the pages listed below, or by using the keyword search tool below to find specific information within the annual report.-
 1
1 -
2
-
3
-
4
-
5
-
6
-
7
-
8
-
9
-
10
-
11
-
12
-
13
-
14
-
15
-
16
-
17
-
18
-
19
-
20
-
21
-
22
-
23
-
24
-
25
-
26
-
27
-
28
-
29
-
30
-
31
-
32
-
33
-
34
-
35
-
36
-
37
-
38
-
39
-
40
-
41
-
42
-
43
-
44
-
45
-
46
-
47
-
48
-
49
-
50
-
51
-
52
-
53
-
54
-
55
-
56
-
57
-
58
-
59
-
60
-
61
-
62
-
63
-
64
-
65
-
66
-
67
-
68
-
69
-
70
-
71
-
72
-
73
-
74
-
75
-
76
-
77
-
78
-
79
-
80
-
81
-
82
-
83
-
84
-
85
-
86
-
87
-
88
-
89
-
90
-
91
-
 92
92 -
 93
93 -
 94
94 -
 95
95 -
 96
96 -
 97
97 -
 98
98 -
 99
99 -
 100
100 -
 101
101 -
 102
102 -
 103
103 -
 104
104 -
 105
105 -
 106
106 -
 107
107 -
 108
108 -
 109
109 -
 110
110 -
 111
111 -
 112
112 -
113
-
114
-
115
-
116
-
117
-
118
-
119
-
120
-
121
-
122
-
123
-
124
-
125
-
126
-
127
-
128
-
129
-
130
-
131
-
132
-
133
-
134
-
135
-
136
-
137
-
138
-
139
-
140
-
141
-
142
-
143
-
144
-
145
-
146
-
147
-
148
-
149
-
150
-
151
-
152
-
153
-
154
-
155
-
156
-
157
-
158
-
159
-
160
-
161
-
162
-
163
-
164
-
165
-
166
-
167
-
168
-
169
-
170
-
171
-
172
-
173
-
174
-
175
-
176
-
177
-
178
-
179
-
180
 |
 |

80 CIGNA CORPORATION2011 Form10K
PART II
ITEM 8 Financial Statements and Supplementary Data
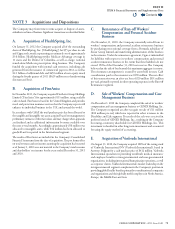
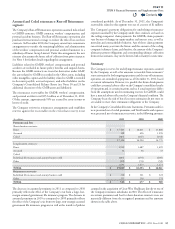
In accordance with GAAP, the total purchase price has been allocated to the tangible and intangible net assets acquired based on management’s
estimates of their fair values. Accordingly, approximately $210million was allocated to intangible assets, primarily customer relationships. e
weighted average amortization period is 15 years. e condensed balance sheet at the acquisition date was as follows:
(In millions)
Investments $ 39
Cash and cash equivalents 73
Premiums, accounts and notes receivable 22
Property and equipment 1
Deferred income taxes (71)
Goodwill 229
Other assets, including other intangibles 220
Total assets acquired 513
Accounts payable, accrued expenses and other liabilities 101
Total liabilities acquired 101
Net assets acquired $ 412
Goodwill was allocated to the International segment. For foreign tax
purposes, the acquisition of Vanbreda International was treated as a
stock purchase. Accordingly, goodwill and other intangible assets will
not be amortized for foreign tax purposes but may reduce the taxability
of earnings repatriated to the U.S. by Vanbreda International.
e results of Vanbreda International are included in the Company’s
Consolidated Financial Statements from the date of acquisition.
e pro forma eect on total revenues and net income assuming the
acquisition had occurred as of January1,2009 was not material to the
Company’s total revenues and shareholders’ net income for the years
ended December31,2010 or 2009.
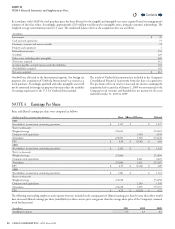
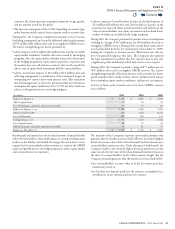
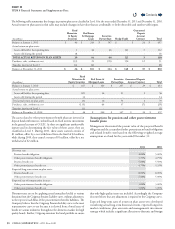
NOTE 4 Earnings Per Share
Basic and diluted earnings per share were computed as follows:
(Dollars in millions, except per share amounts)
Basic Eect of Dilution Diluted
2011
Shareholders’ income from continuing operations $ 1,327 $ - $ 1,327
Shares (in thousands):
Weighted average 270,691 - 270,691
Common stock equivalents 3,558 3,558
Total shares 270,691 3,558 274,249
EPS $ 4.90 $ (0.06) $ 4.84
2010
Shareholders’ income from continuing operations $ 1,345 $ - $ 1,345
Shares (in thousands):
Weighted average 272,866 - 272,866
Common stock equivalents 2,421 2,421
Total shares 272,866 2,421 275,287
EPS $ 4.93 $ (0.04) $ 4.89
2009
Shareholders’ income from continuing operations $ 1,301 $ - $ 1,301
Shares (in thousands):
Weighted average 274,058 - 274,058
Common stock equivalents 1,299 1,299
Total shares 274,058 1,299 275,357
EPS $ 4.75 $ (0.02) $ 4.73
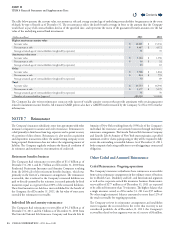
e following outstanding employee stock options were not included in the computation of diluted earnings per share because their eect would
have increased diluted earnings per share (antidilutive) as their exercise price was greater than the average share price of the Company’s common
stock for the period.
(In millions)
2011 2010 2009
Antidilutive options 3.7 6.3 8.8
Contents
Q