Cigna 2011 Annual Report Download - page 114
Download and view the complete annual report
Please find page 114 of the 2011 Cigna annual report below. You can navigate through the pages in the report by either clicking on the pages listed below, or by using the keyword search tool below to find specific information within the annual report.-
 1
1 -
2
-
3
-
4
-
5
-
6
-
7
-
8
-
9
-
10
-
11
-
12
-
13
-
14
-
15
-
16
-
17
-
18
-
19
-
20
-
21
-
22
-
23
-
24
-
25
-
26
-
27
-
28
-
29
-
30
-
31
-
32
-
33
-
34
-
35
-
36
-
37
-
38
-
39
-
40
-
41
-
42
-
43
-
44
-
45
-
46
-
47
-
48
-
49
-
50
-
51
-
52
-
53
-
54
-
55
-
56
-
57
-
58
-
59
-
60
-
61
-
62
-
63
-
64
-
65
-
66
-
67
-
68
-
69
-
70
-
71
-
72
-
73
-
74
-
75
-
76
-
77
-
78
-
79
-
80
-
81
-
82
-
83
-
84
-
85
-
86
-
87
-
88
-
89
-
90
-
91
-
92
-
93
-
94
-
95
-
96
-
97
-
98
-
99
-
100
-
101
-
102
-
103
-
 104
104 -
 105
105 -
 106
106 -
 107
107 -
 108
108 -
 109
109 -
 110
110 -
 111
111 -
 112
112 -
 113
113 -
 114
114 -
 115
115 -
 116
116 -
 117
117 -
 118
118 -
 119
119 -
 120
120 -
 121
121 -
 122
122 -
 123
123 -
 124
124 -
125
-
126
-
127
-
128
-
129
-
130
-
131
-
132
-
133
-
134
-
135
-
136
-
137
-
138
-
139
-
140
-
141
-
142
-
143
-
144
-
145
-
146
-
147
-
148
-
149
-
150
-
151
-
152
-
153
-
154
-
155
-
156
-
157
-
158
-
159
-
160
-
161
-
162
-
163
-
164
-
165
-
166
-
167
-
168
-
169
-
170
-
171
-
172
-
173
-
174
-
175
-
176
-
177
-
178
-
179
-
180
 |
 |
92 CIGNA CORPORATION2011 Form10K
PART II
ITEM 8 Financial Statements and Supplementary Data
pricing statistics and trends. ese reviews are also designed to ensure
prices do not become stale, have reasonable explanations as to why
they have changed from prior valuations, or require additional review
of other anomalies. e Company also performs sample testing of sales
values to conrm the accuracy of prior fair value estimates. Exceptions
identied during these processes indicate that adjustments to prices
are infrequent and result in immaterial adjustments to valuations.
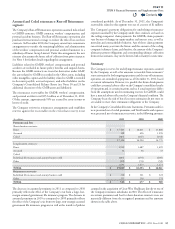
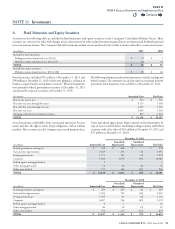
Financial Assets and Financial Liabilities Carried
at Fair Value
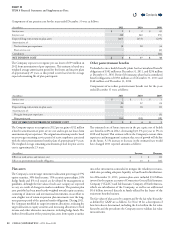
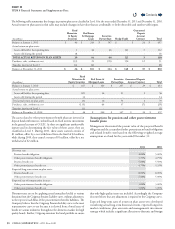
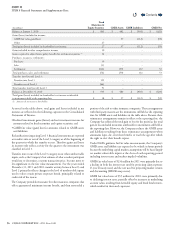
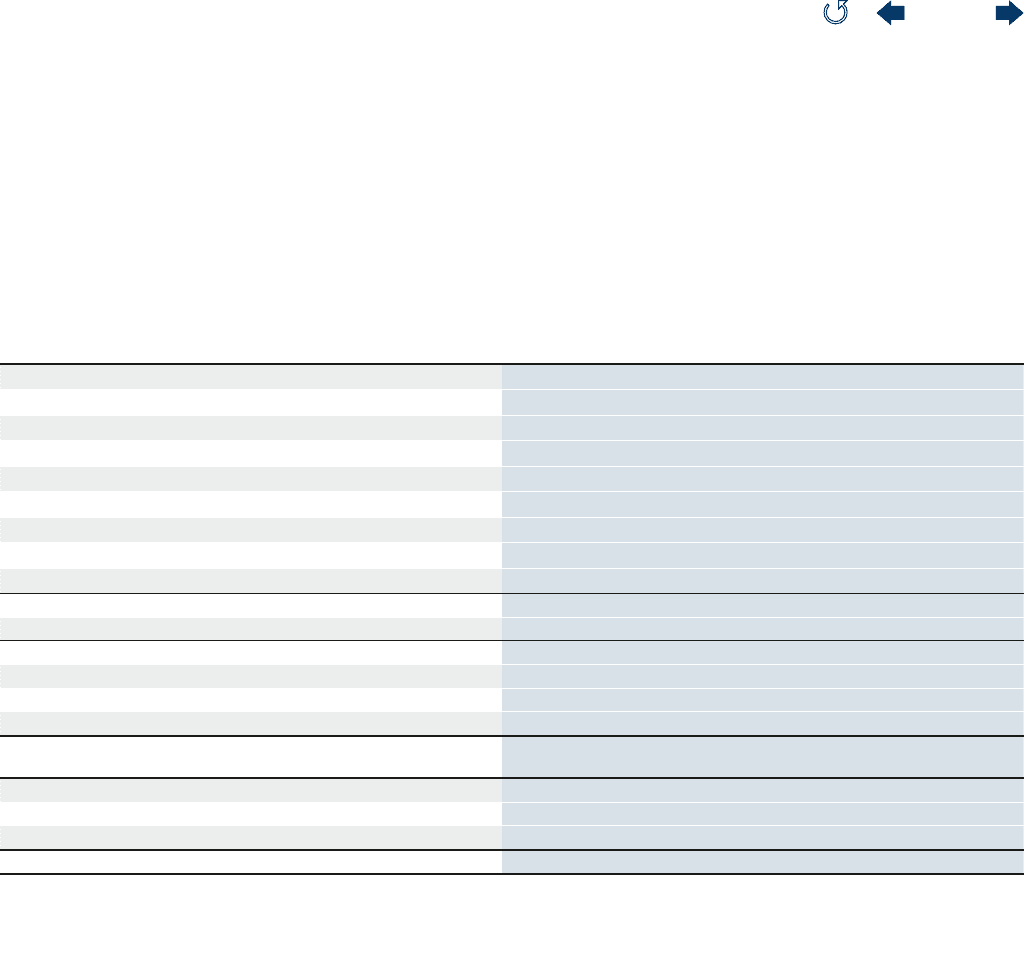
e following tables provide information as of December31,2011 and
December31,2010 about the Company’s nancial assets and liabilities
carried at fair value. Similar disclosures for separate account assets, which
are also recorded at fair value on the Company’s Consolidated Balance
Sheets, are provided separately as gains and losses related to these assets
generally accrue directly to policyholders. In addition, Note9 contains
similar disclosures for the Company’s pension plan assets.
December31,2011
(In millions)
Quoted Prices in
Active Markets for
Identical Assets
(Level1)
Signicant Other
Observable Inputs
(Level2)
Signicant
Unobservable
Inputs
(Level3) Total
Financial assets at fair value:
Fixed maturities:
Federal government and agency $ 217 $ 738 $ 3 $ 958
State and local government - 2,456 - 2,456
Foreign government - 1,251 23 1,274
Corporate - 10,132 381 10,513
Federal agency mortgage-backed - 9 - 9
Other mortgage-backed - 79 1 80
Other asset-backed - 363 564 927
Total xed maturities(1) 217 15,028 972 16,217
Equity securities 3 67 30 100
Subtotal 220 15,095 1,002 16,317
Short-term investments - 225 - 225
GMIB assets(2) - - 712 712
Other derivative assets(3) - 45 - 45
TOTAL FINANCIAL ASSETS AT FAIR VALUE, EXCLUDING
SEPARATE ACCOUNTS $ 220 $ 15,365 $ 1,714 $ 17,299
Financial liabilities at fair value:
GMIB liabilities $ - $ - $ 1,333 $ 1,333
Other derivative liabilities(3) - 30 - 30
TOTAL FINANCIAL LIABILITIES AT FAIR VALUE $ $ 30 $ 1,333 $ 1,363
(1) Fixed maturities include $826million of net appreciation required to adjust future policy benefits for the run-off settlement annuity business including $115million of appreciation
for securities classified in Level3.
(2) The GMIB assets represent retrocessional contracts in place from two external reinsurers which cover 55% of the exposures on these contracts.
(3) Other derivative assets include $10million of interest rate and foreign currency swaps qualifying as cash flow hedges and $35million of interest rate swaps not designated as accounting
hedges. Other derivative liabilities reflect foreign currency and interest rate swaps qualifying as cash flow hedges. See Note12 for additional information.
Contents
Q