Cigna 2011 Annual Report Download - page 112
Download and view the complete annual report
Please find page 112 of the 2011 Cigna annual report below. You can navigate through the pages in the report by either clicking on the pages listed below, or by using the keyword search tool below to find specific information within the annual report.-
 1
1 -
2
-
3
-
4
-
5
-
6
-
7
-
8
-
9
-
10
-
11
-
12
-
13
-
14
-
15
-
16
-
17
-
18
-
19
-
20
-
21
-
22
-
23
-
24
-
25
-
26
-
27
-
28
-
29
-
30
-
31
-
32
-
33
-
34
-
35
-
36
-
37
-
38
-
39
-
40
-
41
-
42
-
43
-
44
-
45
-
46
-
47
-
48
-
49
-
50
-
51
-
52
-
53
-
54
-
55
-
56
-
57
-
58
-
59
-
60
-
61
-
62
-
63
-
64
-
65
-
66
-
67
-
68
-
69
-
70
-
71
-
72
-
73
-
74
-
75
-
76
-
77
-
78
-
79
-
80
-
81
-
82
-
83
-
84
-
85
-
86
-
87
-
88
-
89
-
90
-
91
-
92
-
93
-
94
-
95
-
96
-
97
-
98
-
99
-
100
-
101
-
 102
102 -
 103
103 -
 104
104 -
 105
105 -
 106
106 -
 107
107 -
 108
108 -
 109
109 -
 110
110 -
 111
111 -
 112
112 -
 113
113 -
 114
114 -
 115
115 -
 116
116 -
 117
117 -
 118
118 -
 119
119 -
 120
120 -
 121
121 -
 122
122 -
123
-
124
-
125
-
126
-
127
-
128
-
129
-
130
-
131
-
132
-
133
-
134
-
135
-
136
-
137
-
138
-
139
-
140
-
141
-
142
-
143
-
144
-
145
-
146
-
147
-
148
-
149
-
150
-
151
-
152
-
153
-
154
-
155
-
156
-
157
-
158
-
159
-
160
-
161
-
162
-
163
-
164
-
165
-
166
-
167
-
168
-
169
-
170
-
171
-
172
-
173
-
174
-
175
-
176
-
177
-
178
-
179
-
180
 |
 |

90 CIGNA CORPORATION2011 Form10K
PART II
ITEM 8 Financial Statements and Supplementary Data
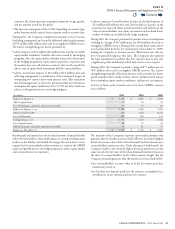
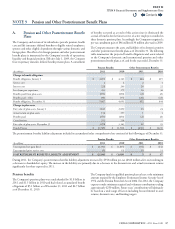
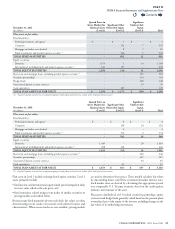
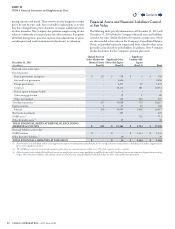
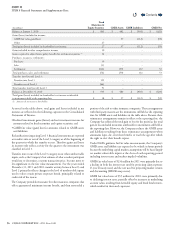
e following table summarizes the changes in pension plan assets classied in Level3 for the years ended December31,2011 and December31,2010.
Actual return on plan assets in this table may include changes in fair value that are attributable to both observable and unobservable inputs.
(In millions)
Fixed
Maturities
&Equity
Securities
Real Estate
& Mortgage
Loans
Securities
Partnerships Hedge Funds
Guaranteed
Deposit
Account
Contract Total
Balance at January 1, 2011 $ 46 $ 240 $ 347 $ - $ 24 $ 657
Actual return on plan assets:
Assets still held at the reporting date 1 44 66 (2) 3 112
Assets sold during the period 18 - - - - 18
TOTAL ACTUAL RETURN ONPLAN ASSETS 19 44 66 2 3 130
Purchases, sales, settlements, net (33) 21 (99) 150 12 51
Transfers into/out of Level 3 (6) (2) - - - (8)
Balance at December 31, 2011 $ 26 $ 303 $ 314 $ 148 $ 39 $ 830
(In millions)
Fixed
Maturities&
Equity Securities
Real Estate&
Mortgage Loans
Securities
Partnerships
Guaranteed Deposit
Account Contract Total
Balance at January1,2010 $ 167 $ 160 $ 257 $ 29 $ 613
Actual return on plan assets:
Assets still held at the reporting date (15) 16 53 2 56
Assets sold during the period 14 - - - 14
Total actual return on plan assets (1) 16 53 2 70
Purchases, sales, settlements, net (119) 64 37 (7) (25)
Transfers into/out of Level3 (1) - - - (1)
Balance at December31,2010 $ 46 $ 240 $ 347 $ 24 $ 657
e assets related to other postretirement benet plans are invested in
deposit funds with interest credited based on xed income investments
in the general account of CGLIC. As there are signicant unobservable
inputs used in determining the fair value of these assets, they are
classied as Level3. During 2011, these assets earned a return of
$1million, oset by a net withdrawal from the fund of $2million,
while during 2010, they earned a return of $1million, oset by a net
withdrawal of $2million.
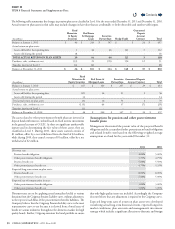
Assumptions for pension and other postretirement
benefit plans
Management determined the present value of the projected benet
obligation and the accumulated other postretirement benet obligation
and related benet costs based on the following weighted average
assumptions as of and for the years ended December31:
2011 2010
Discount rate:
Pension benet obligation 4.00% 5.00%
Other postretirement benet obligation 3.75% 4.75%
Pension benet cost 5.00% 5.50%
Other postretirement benet cost 4.75% 5.25%
Expected long-term return on plan assets:
Pension benet cost 8.00% 8.00%
Other postretirement benet cost 5.00% 5.00%
Expected rate of compensation increase:
Other postretirement benet obligation 3.00% 3.00%
Other postretirement benet cost 3.00% 3.00%
Discount rates are set by applying actual annualized yields at various
durations from the Citigroup Pension Liability curve, without adjustment,
to the expected cash ows of the postretirement benets liabilities. e
Company believes that the Citigroup Pension Liability curve is the most
representative curve to use because it is derived from a broad array of
bonds in various industries throughout the domestic market for high
quality bonds. Further, Citigroup monitors the bond portfolio to ensure
that only high quality issues are included. Accordingly, the Company
does not believe that any adjustment is required to the Citigroup curve.
Expected long-term rates of return on plan assets were developed
considering actual long-term historical returns, expected long-term
market conditions, plan asset mix and management’s investment
strategy, which includes a signicant allocation to domestic and foreign
Contents
Q