Cigna 2011 Annual Report Download - page 67
Download and view the complete annual report
Please find page 67 of the 2011 Cigna annual report below. You can navigate through the pages in the report by either clicking on the pages listed below, or by using the keyword search tool below to find specific information within the annual report.-
 1
1 -
2
-
3
-
4
-
5
-
6
-
7
-
8
-
9
-
10
-
11
-
12
-
13
-
14
-
15
-
16
-
17
-
18
-
19
-
20
-
21
-
22
-
23
-
24
-
25
-
26
-
27
-
28
-
29
-
30
-
31
-
32
-
33
-
34
-
35
-
36
-
37
-
38
-
39
-
40
-
41
-
42
-
43
-
44
-
45
-
46
-
47
-
48
-
49
-
50
-
51
-
52
-
53
-
54
-
55
-
56
-
 57
57 -
 58
58 -
 59
59 -
 60
60 -
 61
61 -
 62
62 -
 63
63 -
 64
64 -
 65
65 -
 66
66 -
 67
67 -
 68
68 -
 69
69 -
 70
70 -
 71
71 -
 72
72 -
 73
73 -
 74
74 -
 75
75 -
 76
76 -
 77
77 -
78
-
79
-
80
-
81
-
82
-
83
-
84
-
85
-
86
-
87
-
88
-
89
-
90
-
91
-
92
-
93
-
94
-
95
-
96
-
97
-
98
-
99
-
100
-
101
-
102
-
103
-
104
-
105
-
106
-
107
-
108
-
109
-
110
-
111
-
112
-
113
-
114
-
115
-
116
-
117
-
118
-
119
-
120
-
121
-
122
-
123
-
124
-
125
-
126
-
127
-
128
-
129
-
130
-
131
-
132
-
133
-
134
-
135
-
136
-
137
-
138
-
139
-
140
-
141
-
142
-
143
-
144
-
145
-
146
-
147
-
148
-
149
-
150
-
151
-
152
-
153
-
154
-
155
-
156
-
157
-
158
-
159
-
160
-
161
-
162
-
163
-
164
-
165
-
166
-
167
-
168
-
169
-
170
-
171
-
172
-
173
-
174
-
175
-
176
-
177
-
178
-
179
-
180
 |
 |

45CIGNA CORPORATION2011 Form10K
PART II
ITEM 7 Management’s Discussion and Analysis of Financial Condition and Results of Operations
Segment Reporting
Operating segments generally reect groups of related products,
but the International segment is generally based on geography. e
Company measures the nancial results of its segments using “segment
earnings (loss)”, which is dened as shareholders’ income (loss) from
continuing operations excluding after-tax realized investment gains
and losses. “Adjusted income from operations” for each segment is
dened as segment earnings excluding special items and the results of
the Company’s GMIB business. Adjusted income from operations is
another measure of protability used by the Company’s management
because it presents the underlying results of operations of the segment
and permits analysis of trends. is measure is not determined in
accordance with GAAP and should not be viewed as a substitute for the
most directly comparable GAAP measure, which is segment earnings.
Each segment provides a reconciliation between segment earnings and
adjusted income from operations.
Beginning in 2010, the Company began reporting the expense associated
with its frozen pension plans in Corporate. Prior periods were not
restated; the eect on prior periods is not material.
Health Care Segment
Segment Description
e Health Care segment oers insured and self-insured medical,
dental, behavioral health, vision, and prescription drug benet plans,
health advocacy programs and other products and services that may
be integrated to provide comprehensive health care benet programs.
Cigna HealthCare companies oer these products and services in
all 50 states, the District of Columbia and the U.S. Virgin Islands.
ese products and services are oered through a variety of funding
arrangements such as guaranteed cost, retrospectively experience-rated
and administrative services only (“ASO”) arrangements.
e Company measures the operating eectiveness of the Health Care
segment using the following key factors:
•segment earnings and adjusted income from operations;
•membership growth;
•sales of specialty products to core medical customers;
•
operating expenses as a percentage of segment revenues (operating
expense ratio);
•changes in operating expenses per member; and
•
medical expense as a percentage of premiums (medical care ratio) in
the guaranteed cost business.
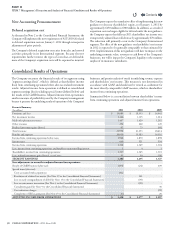
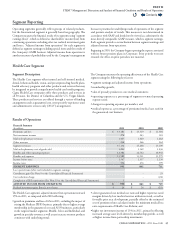
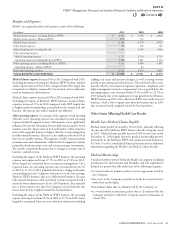
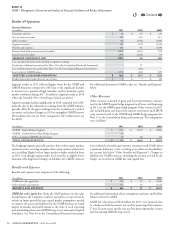
Results of Operations
Financial Summary
(In millions)
2011 2010 2009
Premiums and fees $ 13,181 $ 13,319 $ 11,384
Net investment income 274 243 181
Mail order pharmacy revenues 1,447 1,420 1,282
Other revenues 234 266 262
Segment revenues 15,136 15,248 13,109
Mail order pharmacy cost of goods sold 1,203 1,169 1,036
Benets and other operating expenses 12,386 12,742 10,943
Benets and expenses 13,589 13,911 11,979
Income before taxes 1,547 1,337 1,130
Income taxes 556 476 399
SEGMENT EARNINGS 991 861 731
Less: special items (after-tax) included in segment earnings:
Curtailment gain (See Note9 to the Consolidated Financial Statements) - - 25
Cost reduction charge - - (24)
Completion of IRS examination (See Note19 to the Consolidated Financial Statements) 1 - 1
ADJUSTED INCOME FROM OPERATIONS $ 990 $ 861 $ 729
Realized investment gains (losses), net of taxes $ 24 $ 26 $ (19)
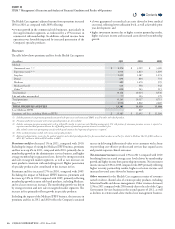
e Health Care segment’s adjustedincome from operations increased
15% in 2011, as compared with 2010 reecting:
•
growth in premiums and fees of 6% in 2011, excluding the impact of
exiting the Medicare IPFFS business, primarily due to higher average
membership in the guaranteed cost and ASO businesses, particularly
in the targeted market segments: Middle, Select and Individual, and
growth in specialty revenues as well as rate increases on most products
consistent with underlying trend;
•
a lower guaranteed cost medical care ratio and higher experience-rated
margins driven by low medical services utilization trend, as well as
favorable prior year development, partially oset by the estimated
cost of premium rebates calculated under the minimum medical loss
ratio requirements of Health Care Reform; and
•higher net investment income of 13% in 2011, primarily reecting
increased average asset levels driven by membership growth, as well
as higher income from partnership investments.
Contents
Q