Cigna 2011 Annual Report Download - page 118
Download and view the complete annual report
Please find page 118 of the 2011 Cigna annual report below. You can navigate through the pages in the report by either clicking on the pages listed below, or by using the keyword search tool below to find specific information within the annual report.-
 1
1 -
2
-
3
-
4
-
5
-
6
-
7
-
8
-
9
-
10
-
11
-
12
-
13
-
14
-
15
-
16
-
17
-
18
-
19
-
20
-
21
-
22
-
23
-
24
-
25
-
26
-
27
-
28
-
29
-
30
-
31
-
32
-
33
-
34
-
35
-
36
-
37
-
38
-
39
-
40
-
41
-
42
-
43
-
44
-
45
-
46
-
47
-
48
-
49
-
50
-
51
-
52
-
53
-
54
-
55
-
56
-
57
-
58
-
59
-
60
-
61
-
62
-
63
-
64
-
65
-
66
-
67
-
68
-
69
-
70
-
71
-
72
-
73
-
74
-
75
-
76
-
77
-
78
-
79
-
80
-
81
-
82
-
83
-
84
-
85
-
86
-
87
-
88
-
89
-
90
-
91
-
92
-
93
-
94
-
95
-
96
-
97
-
98
-
99
-
100
-
101
-
102
-
103
-
104
-
105
-
106
-
107
-
 108
108 -
 109
109 -
 110
110 -
 111
111 -
 112
112 -
 113
113 -
 114
114 -
 115
115 -
 116
116 -
 117
117 -
 118
118 -
 119
119 -
 120
120 -
 121
121 -
 122
122 -
 123
123 -
 124
124 -
 125
125 -
 126
126 -
 127
127 -
 128
128 -
129
-
130
-
131
-
132
-
133
-
134
-
135
-
136
-
137
-
138
-
139
-
140
-
141
-
142
-
143
-
144
-
145
-
146
-
147
-
148
-
149
-
150
-
151
-
152
-
153
-
154
-
155
-
156
-
157
-
158
-
159
-
160
-
161
-
162
-
163
-
164
-
165
-
166
-
167
-
168
-
169
-
170
-
171
-
172
-
173
-
174
-
175
-
176
-
177
-
178
-
179
-
180
 |
 |
96 CIGNA CORPORATION2011 Form10K
PART II
ITEM 8 Financial Statements and Supplementary Data
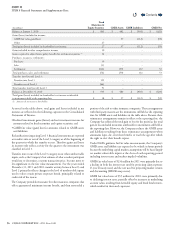
(In millions)
Fixed
Maturities&
Equity Securities GMIB Assets GMIB Liabilities GMIB Net
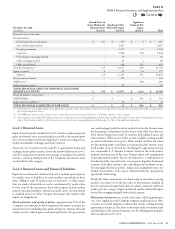
Balance at January1,2010 $ 845 $ 482 $ (903) $ (421)
Gains (losses) included in income:
GMIB fair value gain/(loss) - 57 (112) (55)
Other 27 - - -
Total gains (losses) included in shareholders’ net income 27 57 (112) (55)
Gains included in other comprehensive income 10 - - -
Gains required to adjust future policy benets for settlement annuities(1) 34 - - -
Purchases, issuances, settlements:
Purchases 39 - - -
Sales (1) - - -
Settlements (112) (59) 112 53
Total purchases, sales, and settlements (74) (59) 112 53
Transfers into/(out of) Level3:
Transfers into Level3 155 - - -
Transfers out of Level3 (64) - - -
Total transfers into/(out of) Level3 91 - - -
Balance at December31,2010 $ 933 $ 480 $ (903) $ (423)
Total gains (losses) included in shareholders’ net income attributable
toinstruments held at the reporting date $ 18 $ 57 $ (112) $ (55)
(1) Amounts do not accrue to shareholders.
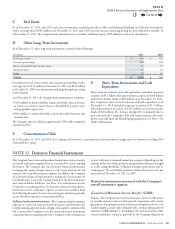
As noted in the tables above, total gains and losses included in net
income are reected in the following captions in the Consolidated
Statements of Income:
•
Realized investment gains (losses) and net investment income for
amounts related to xed maturities and equity securities; and
•
GMIB fair value (gain) loss for amounts related to GMIB assets
and liabilities.
Reclassications impacting Level3 nancial instruments are reported
as transfers into or out of the Level3 category as of the beginning of
the quarter in which the transfer occurs. erefore gains and losses
in income only reect activity for the quarters the instrument was
classied in Level3.
Transfers into or out of the Level3 category occur when unobservable
inputs, such as the Company’s best estimate of what a market participant
would use to determine a current transaction price, become more or
less signicant to the fair value measurement. For the years ended
December31,2011 and 2010, transfer activity between Level3 and
Level2 primarily reects changes in the level of unobservable inputs
used to value certain private corporate bonds, principally related to
credit risk of the issuers.
e Company provided reinsurance for other insurance companies that
oer a guaranteed minimum income benet, and then retroceded a
portion of the risk to other insurance companies. ese arrangements
with third-party insurers are the instruments still held at the reporting
date for GMIB assets and liabilities in the table above. Because these
reinsurance arrangements remain in eect at the reporting date, the
Company has reected the total gain or loss for the period as the total
gain or loss included in income attributable to instruments still held at
the reporting date. However, the Company reduces the GMIB assets
and liabilities resulting from these reinsurance arrangements when
annuitants lapse, die, elect their benet, or reach the age after which
the right to elect their benet expires.
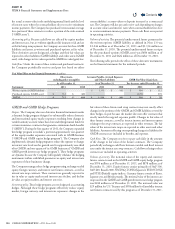
Under FASB’s guidance for fair value measurements, the Company’s
GMIB assets and liabilities are expected to be volatile in future periods
because the underlying capital markets assumptions will be based largely
on market-observable inputs at the close of each reporting period
including interest rates and market-implied volatilities.
GMIB fair value losses of $234million for 2011 were primarily due to
a decline in both the interest rate used for projecting claim exposure
(7-year Treasury rates) and the rate used for projecting market returns
and discounting (LIBOR swap curve).
GMIB fair value losses of $55million for 2010, were primarily due
to declining interest rates, partially oset by increases in underlying
account values resulting from favorable equity and bond fund returns,
which resulted in decreased exposures.
Contents
Q