Cigna 2011 Annual Report Download - page 90
Download and view the complete annual report
Please find page 90 of the 2011 Cigna annual report below. You can navigate through the pages in the report by either clicking on the pages listed below, or by using the keyword search tool below to find specific information within the annual report.-
 1
1 -
2
-
3
-
4
-
5
-
6
-
7
-
8
-
9
-
10
-
11
-
12
-
13
-
14
-
15
-
16
-
17
-
18
-
19
-
20
-
21
-
22
-
23
-
24
-
25
-
26
-
27
-
28
-
29
-
30
-
31
-
32
-
33
-
34
-
35
-
36
-
37
-
38
-
39
-
40
-
41
-
42
-
43
-
44
-
45
-
46
-
47
-
48
-
49
-
50
-
51
-
52
-
53
-
54
-
55
-
56
-
57
-
58
-
59
-
60
-
61
-
62
-
63
-
64
-
65
-
66
-
67
-
68
-
69
-
70
-
71
-
72
-
73
-
74
-
75
-
76
-
77
-
78
-
79
-
 80
80 -
 81
81 -
 82
82 -
 83
83 -
 84
84 -
 85
85 -
 86
86 -
 87
87 -
 88
88 -
 89
89 -
 90
90 -
 91
91 -
 92
92 -
 93
93 -
 94
94 -
 95
95 -
 96
96 -
 97
97 -
 98
98 -
 99
99 -
 100
100 -
101
-
102
-
103
-
104
-
105
-
106
-
107
-
108
-
109
-
110
-
111
-
112
-
113
-
114
-
115
-
116
-
117
-
118
-
119
-
120
-
121
-
122
-
123
-
124
-
125
-
126
-
127
-
128
-
129
-
130
-
131
-
132
-
133
-
134
-
135
-
136
-
137
-
138
-
139
-
140
-
141
-
142
-
143
-
144
-
145
-
146
-
147
-
148
-
149
-
150
-
151
-
152
-
153
-
154
-
155
-
156
-
157
-
158
-
159
-
160
-
161
-
162
-
163
-
164
-
165
-
166
-
167
-
168
-
169
-
170
-
171
-
172
-
173
-
174
-
175
-
176
-
177
-
178
-
179
-
180
 |
 |

68 CIGNA CORPORATION2011 Form10K
PART II
ITEM 8 Financial Statements and Supplementary Data
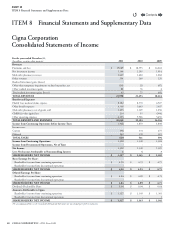
ITEM 8 Financial Statements and Supplementary Data
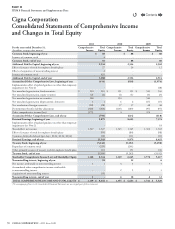
Cigna Corporation
Consolidated Statements of Income
For the years ended December31,
(In millions, except per share amounts)
2011 2010 2009
Revenues
Premiums and fees $ 19,089 $ 18,393 $ 16,041
Net investment income 1,146 1,105 1,014
Mail order pharmacy revenues 1,447 1,420 1,282
Other revenues 254 260 120
Realized investment gains (losses)
Other-than-temporary impairments on xed maturities, net (26) (1) (47)
Other realized investment gains 88 76 4
Total realized investment gains (losses) 62 75 (43)
TOTAL REVENUES 21,998 21,253 18,414
Benets and Expenses
Health Care medical claims expense 8,182 8,570 6,927
Other benet expenses 4,308 3,663 3,407
Mail order pharmacy cost of goods sold 1,203 1,169 1,036
GMIB fair value (gain) loss 234 55 (304)
Other operating expenses 6,103 5,926 5,450
TOTAL BENEFITS AND EXPENSES 20,030 19,383 16,516
Income from Continuing Operations before Income Taxes 1,968 1,870 1,898
Income taxes:
Current 398 331 275
Deferred 242 190 319
TOTAL TAXES 640 521 594
Income from Continuing Operations 1,328 1,349 1,304
Income from Discontinued Operations, Net of Taxes - - 1
Net Income 1,328 1,349 1,305
Less: Net Income Attributable to Noncontrolling Interest 1 4 3
SHAREHOLDERS’ NET INCOME $ 1,327 $ 1,345 $ 1,302
Basic Earnings Per Share:
Shareholders’ income from continuing operations $ 4.90 $ 4.93 $ 4.75
Shareholders’ income from discontinued operations - - -
SHAREHOLDERS’ NET INCOME $ 4.90 $ 4.93 $ 4.75
Diluted Earnings Per Share:
Shareholders’ income from continuing operations $ 4.84 $ 4.89 $ 4.73
Shareholders’ income from discontinued operations - - -
SHAREHOLDERS’ NET INCOME $ 4.84 $ 4.89 $ 4.73
Dividends Declared Per Share $ 0.04 $ 0.04 $ 0.04
Amounts Attributable to Cigna:
Shareholders’ income from continuing operations $ 1,327 $ 1,345 $ 1,301
Shareholders’ income from discontinued operations - - 1
SHAREHOLDERS’ NET INCOME $ 1,327 $ 1,345 $ 1,302
The accompanying Notesto the Consolidated Financial Statements are an integral part of these statements.
Contents
Q