Cigna 2011 Annual Report Download - page 117
Download and view the complete annual report
Please find page 117 of the 2011 Cigna annual report below. You can navigate through the pages in the report by either clicking on the pages listed below, or by using the keyword search tool below to find specific information within the annual report.-
 1
1 -
2
-
3
-
4
-
5
-
6
-
7
-
8
-
9
-
10
-
11
-
12
-
13
-
14
-
15
-
16
-
17
-
18
-
19
-
20
-
21
-
22
-
23
-
24
-
25
-
26
-
27
-
28
-
29
-
30
-
31
-
32
-
33
-
34
-
35
-
36
-
37
-
38
-
39
-
40
-
41
-
42
-
43
-
44
-
45
-
46
-
47
-
48
-
49
-
50
-
51
-
52
-
53
-
54
-
55
-
56
-
57
-
58
-
59
-
60
-
61
-
62
-
63
-
64
-
65
-
66
-
67
-
68
-
69
-
70
-
71
-
72
-
73
-
74
-
75
-
76
-
77
-
78
-
79
-
80
-
81
-
82
-
83
-
84
-
85
-
86
-
87
-
88
-
89
-
90
-
91
-
92
-
93
-
94
-
95
-
96
-
97
-
98
-
99
-
100
-
101
-
102
-
103
-
104
-
105
-
106
-
 107
107 -
 108
108 -
 109
109 -
 110
110 -
 111
111 -
 112
112 -
 113
113 -
 114
114 -
 115
115 -
 116
116 -
 117
117 -
 118
118 -
 119
119 -
 120
120 -
 121
121 -
 122
122 -
 123
123 -
 124
124 -
 125
125 -
 126
126 -
 127
127 -
128
-
129
-
130
-
131
-
132
-
133
-
134
-
135
-
136
-
137
-
138
-
139
-
140
-
141
-
142
-
143
-
144
-
145
-
146
-
147
-
148
-
149
-
150
-
151
-
152
-
153
-
154
-
155
-
156
-
157
-
158
-
159
-
160
-
161
-
162
-
163
-
164
-
165
-
166
-
167
-
168
-
169
-
170
-
171
-
172
-
173
-
174
-
175
-
176
-
177
-
178
-
179
-
180
 |
 |

95CIGNA CORPORATION2011 Form10K
PART II
ITEM 8 Financial Statements and Supplementary Data
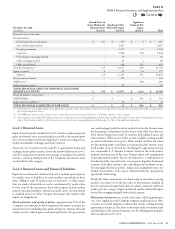
volatility ranges from 16% to 36% for equity funds, 4% to 12% for
bond funds, and 1% to 2% for money market funds.
•
e mortality assumption is 70% of the 1994 Group Annuity Mortality
table, with 1% annual improvement beginning January1,2000.
•
e annual lapse rate assumption reects experience that diers by
the company issuing the underlying variable annuity contracts, ranges
from 1% to 12% at December31,2011, and depends on the time
since contract issue and the relative value of the guarantee.
•
e annual annuity election rate assumption reects experience
that diers by the company issuing the underlying variable annuity
contracts and depends on the annuitant’s age, the relative value
of the guarantee and whether a contractholder has had a previous
opportunity to elect the benet. Immediately after the expiration
of the waiting period, the assumed probability that an individual
will annuitize their variable annuity contract is up to 80%. For the
second and subsequent annual opportunities to elect the benet,
the assumed probability of election is up to 35%. Actual data is still
emerging for the Company as well as the industry and the estimates
are based on this limited data.
•
e nonperformance risk adjustment is incorporated by adding an
additional spread to the discount rate in the calculation of both(1)
the GMIB liability to reect a hypothetical market participant’s
view of the risk of the Company not fullling its GMIB obligations,
and(2) the GMIB asset to reect a hypothetical market participant’s
view of the reinsurers’ credit risk, after considering collateral. e
estimated market-implied spread is company-specic for each party
involved to the extent that company-specic market data is available
and is based on industry averages for similarly-rated companies when
company-specic data is not available. e spread is impacted by
the credit default swap spreads of the specic parent companies,
adjusted to reect subsidiaries’ credit ratings relative to their parent
company and any available collateral. e additional spread over
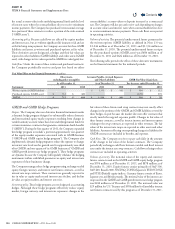
LIBOR incorporated into the discount rate ranged from 20 to 160
basis points for the GMIB liability and from 50 to 125 basis points
for the GMIB reinsurance asset for that portion of the interest rate
curve most relevant to these policies.
•
e risk and prot charge assumption is based on the Company’s
estimate of the capital and return on capital that would be required
by a hypothetical market participant.
e Company regularly evaluates each of the assumptions used in
establishing these assets and liabilities by considering how a hypothetical
market participant would set assumptions at each valuation date. Capital
markets assumptions are expected to change at each valuation date
reecting currently observable market conditions. Other assumptions
may also change based on a hypothetical market participant’s view of
actual experience as it emerges over time or other factors that impact the
net liability. If the emergence of future experience or future assumptions
diers from the assumptions used in estimating these assets and liabilities,
the resulting impact could be material to the Company’s consolidated
results of operations, and in certain situations, could be material to
the Company’s nancial condition.
GMIB liabilities are reported in the Company’s Consolidated Balance
Sheets in Accounts payable, accrued expenses and other liabilities.
GMIB assets associated with these contracts represent net receivables
in connection with reinsurance that the Company has purchased from
two external reinsurers and are reported in the Company’s Consolidated
Balance Sheets in Other assets, including other intangibles.
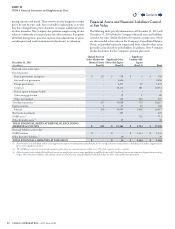
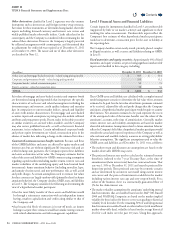
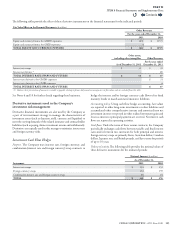
Changes in Level 3 Financial Assets and Financial
Liabilities Carried at Fair Value
The following tables summarize the changes in financial assets
and nancial liabilities classied in Level3 for the years ended
December31,2011 and 2010. ese tables exclude separate account assets
as changes in fair values of these assets accrue directly to policyholders.
Gains and losses reported in this table may include changes in fair
value that are attributable to both observable and unobservable inputs.
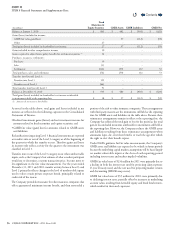
(In millions)
Fixed
Maturities&
Equity Securities GMIB Assets GMIB Liabilities GMIB Net
Balance at January1,2011 $ 933 $ 480 $ (903) $ (423)
Gains (losses) included in income:
GMIB fair value gain/(loss) - 270 (504) (234)
Other 10 - - -
Total gains (losses) included in shareholders’ net income 10 270 (504) (234)
Gains included in other comprehensive income 7 - - -
Gains required to adjust future policy benets for settlement annuities(1) 41 - - -
Purchases, issuances, settlements:
Purchases 129 - - -
Sales (20) - - -
Settlements (61) (38) 74 36
Total purchases, sales and settlements 48 (38) 74 36
Transfers into/(out of) Level3:
Transfers into Level3 81 - - -
Transfers out of Level3 (118) - - -
Total transfers into/(out of) Level3 (37) - - -
Balance at December31,2011 $ 1,002 $ 712 $ (1,333) $ (621)
Total gains (losses) included in shareholders’ net income attributable
toinstruments held at the reporting date $ 6 $ 270 $ (504) $ (234)
(1) Amounts do not accrue to shareholders.
Contents
Q