Cigna 2011 Annual Report Download - page 110
Download and view the complete annual report
Please find page 110 of the 2011 Cigna annual report below. You can navigate through the pages in the report by either clicking on the pages listed below, or by using the keyword search tool below to find specific information within the annual report.-
 1
1 -
2
-
3
-
4
-
5
-
6
-
7
-
8
-
9
-
10
-
11
-
12
-
13
-
14
-
15
-
16
-
17
-
18
-
19
-
20
-
21
-
22
-
23
-
24
-
25
-
26
-
27
-
28
-
29
-
30
-
31
-
32
-
33
-
34
-
35
-
36
-
37
-
38
-
39
-
40
-
41
-
42
-
43
-
44
-
45
-
46
-
47
-
48
-
49
-
50
-
51
-
52
-
53
-
54
-
55
-
56
-
57
-
58
-
59
-
60
-
61
-
62
-
63
-
64
-
65
-
66
-
67
-
68
-
69
-
70
-
71
-
72
-
73
-
74
-
75
-
76
-
77
-
78
-
79
-
80
-
81
-
82
-
83
-
84
-
85
-
86
-
87
-
88
-
89
-
90
-
91
-
92
-
93
-
94
-
95
-
96
-
97
-
98
-
99
-
 100
100 -
 101
101 -
 102
102 -
 103
103 -
 104
104 -
 105
105 -
 106
106 -
 107
107 -
 108
108 -
 109
109 -
 110
110 -
 111
111 -
 112
112 -
 113
113 -
 114
114 -
 115
115 -
 116
116 -
 117
117 -
 118
118 -
 119
119 -
 120
120 -
121
-
122
-
123
-
124
-
125
-
126
-
127
-
128
-
129
-
130
-
131
-
132
-
133
-
134
-
135
-
136
-
137
-
138
-
139
-
140
-
141
-
142
-
143
-
144
-
145
-
146
-
147
-
148
-
149
-
150
-
151
-
152
-
153
-
154
-
155
-
156
-
157
-
158
-
159
-
160
-
161
-
162
-
163
-
164
-
165
-
166
-
167
-
168
-
169
-
170
-
171
-
172
-
173
-
174
-
175
-
176
-
177
-
178
-
179
-
180
 |
 |

88 CIGNA CORPORATION2011 Form10K
PART II
ITEM 8 Financial Statements and Supplementary Data
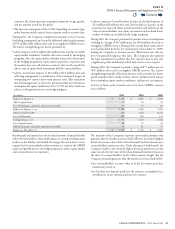
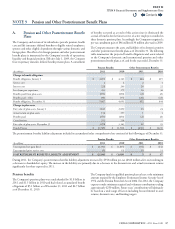
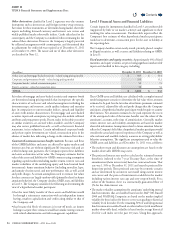
Components of net pension cost for the years ended December31 were as follows:
(In millions)
2011 2010 2009
Service cost $ 2 $ 2 $ 43
Interest cost 228 240 250
Expected long-term return on plan assets (267) (253) (239)
Amortization of:
Net loss from past experience 38 28 34
Prior service cost - - (4)
Curtailment - - (46)
NET PENSION COST $ 1 $ 17 $ 38
e Company expects to recognize pre-tax losses of $59million in
2012 from amortization of past experience. is estimate is based on a
weighted average amortization period for the frozen and inactive plans
of approximately 29 years, as this period is now based on the average
expected remaining life of plan participants.
Other postretirement benefits
Unfunded retiree health benet plans had accumulated benet
obligations of $302million at December31,2011, and $296million
at December31,2010. Retiree life insurance plans had accumulated
benet obligations of $150million as of December31,2011 and
$148million as of December31,2010.
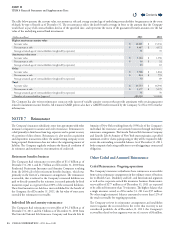
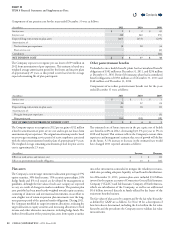
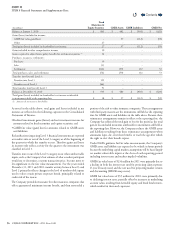
Components of net other postretirement benet cost for the years
ended December31 were as follows:
(In millions)
2011 2010 2009
Service cost $ 2 $ 1 $ 1
Interest cost 20 22 24
Expected long-term return on plan assets (1) (1) (1)
Amortization of:
Net gain from past experience - - (5)
Prior service cost (16) (18) (18)
NET OTHER POSTRETIREMENT BENEFIT COST $ 5 $ 4 $ 1
e Company expects to recognize in 2012 pre-tax gains of $12million
related to amortization of prior service cost and no pre-tax losses from
amortization of past experience. e original amortization period is based
on an average remaining service period of active employees associated
with the other postretirement benet plans of approximately 9 years.
e weighted average remaining amortization period for prior service
cost is approximately 2.5 years.
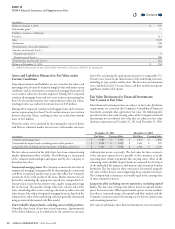
e estimated rate of future increases in the per capita cost of health
care benets is 8% in 2012, decreasing by 0.5% per year to 5% in
2018 and beyond. is estimate reects the Company’s current claim
experience and management’s estimate that rates of growth will decline
in the future. A 1% increase or decrease in the estimated rate would
have changed 2011 reported amounts as follows:
(In millions)
Increase Decrease
Eect on total service and interest cost $ 1 $ (1)
Eect on postretirement benet obligation $ 13 $ (11)
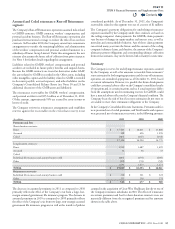
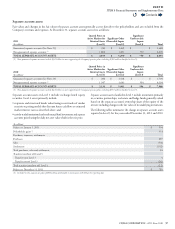
Plan assets
e Company’s current target investment allocation percentages (37%
equity securities, 30% xed income, 15% securities partnerships, 10%
hedge funds and 8% real estate) are developed by management as
guidelines, although the fair values of each asset category are expected
to vary as a result of changes in market conditions. e pension plan
asset portfolio has been most heavily weighted towards equity securities,
consisting of domestic and international investments, in an eort to
earn a higher rate of return on pension plan investments over the long-
term payout period of the pension benet obligations. During 2011,
the Company modied its target investment allocations, reducing the
target allocation to equity securities and increasing allocations to xed
income and other alternative investments, including hedge funds. e
further diversication of the pension plan assets from equity securities
into other investments is intended to mitigate the volatility in returns,
while also providing adequate liquidity to fund benet distributions.
As of December31,2011, pension plan assets included $3.0billion
invested in the separate accounts of Connecticut General Life Insurance
Company (“CGLIC”) and Life Insurance Company of North America,
which are subsidiaries of the Company, as well as an additional
$0.4billion invested directly in funds oered by the buyer of the
retirement benets business.
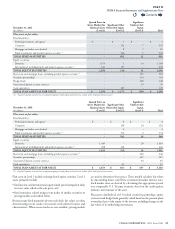
e fair values of plan assets by category and by the fair value hierarchy
as dened by GAAP are as follows. See Note10 for a description of
how fair value is determined, including the level within the fair value
hierarchy and the procedures the Company uses to validate fair value
measurements.
Contents
Q