Cigna 2011 Annual Report Download - page 146
Download and view the complete annual report
Please find page 146 of the 2011 Cigna annual report below. You can navigate through the pages in the report by either clicking on the pages listed below, or by using the keyword search tool below to find specific information within the annual report.-
 1
1 -
2
-
3
-
4
-
5
-
6
-
7
-
8
-
9
-
10
-
11
-
12
-
13
-
14
-
15
-
16
-
17
-
18
-
19
-
20
-
21
-
22
-
23
-
24
-
25
-
26
-
27
-
28
-
29
-
30
-
31
-
32
-
33
-
34
-
35
-
36
-
37
-
38
-
39
-
40
-
41
-
42
-
43
-
44
-
45
-
46
-
47
-
48
-
49
-
50
-
51
-
52
-
53
-
54
-
55
-
56
-
57
-
58
-
59
-
60
-
61
-
62
-
63
-
64
-
65
-
66
-
67
-
68
-
69
-
70
-
71
-
72
-
73
-
74
-
75
-
76
-
77
-
78
-
79
-
80
-
81
-
82
-
83
-
84
-
85
-
86
-
87
-
88
-
89
-
90
-
91
-
92
-
93
-
94
-
95
-
96
-
97
-
98
-
99
-
100
-
101
-
102
-
103
-
104
-
105
-
106
-
107
-
108
-
109
-
110
-
111
-
112
-
113
-
114
-
115
-
116
-
117
-
118
-
119
-
120
-
121
-
122
-
123
-
124
-
125
-
126
-
127
-
128
-
129
-
130
-
131
-
132
-
133
-
134
-
135
-
 136
136 -
 137
137 -
 138
138 -
 139
139 -
 140
140 -
 141
141 -
 142
142 -
 143
143 -
 144
144 -
 145
145 -
 146
146 -
 147
147 -
 148
148 -
 149
149 -
 150
150 -
 151
151 -
 152
152 -
 153
153 -
 154
154 -
 155
155 -
 156
156 -
157
-
158
-
159
-
160
-
161
-
162
-
163
-
164
-
165
-
166
-
167
-
168
-
169
-
170
-
171
-
172
-
173
-
174
-
175
-
176
-
177
-
178
-
179
-
180
 |
 |

124 CIGNA CORPORATION2011 Form10K
PART II
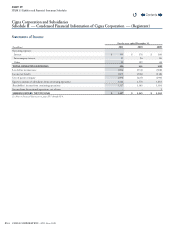
ITEM 8 Quarterly Financial Data (unaudited)
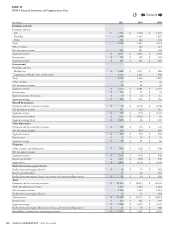
Quarterly Financial Data (unaudited)
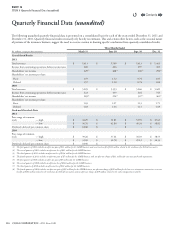
e following unaudited quarterly nancial data is presented on a consolidated basis for each of the years ended December31,2011 and
December31,2010. Quarterly nancial results necessarily rely heavily on estimates. is and certain other factors, such as the seasonal nature
of portions of the insurance business, suggest the need to exercise caution in drawing specic conclusions from quarterly consolidated results.
(In millions, except per share amounts)
ree Months Ended
March31 June30 Sept. 30 Dec. 31
Consolidated Results
2011
Total revenues $ 5,413 $ 5,509 $ 5,613 $ 5,463
Income from continuing operations before income taxes 600 616 297 455
Shareholders’ net income 429 (1) 408(2) 200(3) 290(4)
Shareholders’ net income per share:
Basic 1.59 1.52 0.74 1.05
Diluted 1.57 1.50 0.74 1.04
2010
Total revenues $ 5,205 $ 5,353 $ 5,266 $ 5,429
Income from continuing operations before income taxes 422 439 464 545
Shareholders’ net income 283(5) 294(6) 307(7) 461(8)
Shareholders’ net income per share:
Basic 1.03 1.07 1.13 1.71
Diluted 1.02 1.06 1.13 1.69
Stock and Dividend Data
2011
Price range of common
stock — high $ 44.29 $ 51.81 $ 52.95 $ 47.61
— low $ 36.76 $ 42.80 $ 40.24 $ 38.82
Dividends declared per common share $ 0.040 $ - $ - $ -
2010
Price range of common
stock — high $ 39.26 $ 37.61 $ 36.03 $ 38.53
— low $ 32.00 $ 30.78 $ 29.12 $ 34.33
Dividends declared per common share $ 0.040 $ - $ - $ -
(1) The first quarter of 2011 includes an after-tax gain of $13million for the GMIB business and a net tax benefit of $24million related to the resolution of a Federal tax matter.
(2) The second quarter of 2011 includes an after-tax loss of $21million for the GMIB business.
(3) The third quarter of 2011 includes an after-tax loss of $134million for the GMIB business.
(4) The fourth quarter of 2011 includes an after-tax gain of $7million for the GMIB business and, an after-tax charge of $31million for costs associated with acquisitions.
(5) The first quarter of 2010 includes an after-tax gain of $5million for the GMIB business.
(6) The second quarter of 2010 includes an after-tax loss of $104million for the GMIB business.
(7) The third quarter of 2010 includes an after-tax loss of $10million for the GMIB business.
(8) The fourth quarter of 2010 includes an after-tax gain of $85million for the GMIB business, an after-tax charge of $20million for the loss on a reinsurance transaction, a net tax
benefit of $101million related to the resolution of a Federal tax matter, and an after-tax charge of $39million related to the early extinguishment of debt.
Contents
Q