Cigna 2011 Annual Report Download - page 120
Download and view the complete annual report
Please find page 120 of the 2011 Cigna annual report below. You can navigate through the pages in the report by either clicking on the pages listed below, or by using the keyword search tool below to find specific information within the annual report.-
 1
1 -
2
-
3
-
4
-
5
-
6
-
7
-
8
-
9
-
10
-
11
-
12
-
13
-
14
-
15
-
16
-
17
-
18
-
19
-
20
-
21
-
22
-
23
-
24
-
25
-
26
-
27
-
28
-
29
-
30
-
31
-
32
-
33
-
34
-
35
-
36
-
37
-
38
-
39
-
40
-
41
-
42
-
43
-
44
-
45
-
46
-
47
-
48
-
49
-
50
-
51
-
52
-
53
-
54
-
55
-
56
-
57
-
58
-
59
-
60
-
61
-
62
-
63
-
64
-
65
-
66
-
67
-
68
-
69
-
70
-
71
-
72
-
73
-
74
-
75
-
76
-
77
-
78
-
79
-
80
-
81
-
82
-
83
-
84
-
85
-
86
-
87
-
88
-
89
-
90
-
91
-
92
-
93
-
94
-
95
-
96
-
97
-
98
-
99
-
100
-
101
-
102
-
103
-
104
-
105
-
106
-
107
-
108
-
109
-
 110
110 -
 111
111 -
 112
112 -
 113
113 -
 114
114 -
 115
115 -
 116
116 -
 117
117 -
 118
118 -
 119
119 -
 120
120 -
 121
121 -
 122
122 -
 123
123 -
 124
124 -
 125
125 -
 126
126 -
 127
127 -
 128
128 -
 129
129 -
 130
130 -
131
-
132
-
133
-
134
-
135
-
136
-
137
-
138
-
139
-
140
-
141
-
142
-
143
-
144
-
145
-
146
-
147
-
148
-
149
-
150
-
151
-
152
-
153
-
154
-
155
-
156
-
157
-
158
-
159
-
160
-
161
-
162
-
163
-
164
-
165
-
166
-
167
-
168
-
169
-
170
-
171
-
172
-
173
-
174
-
175
-
176
-
177
-
178
-
179
-
180
 |
 |
98 CIGNA CORPORATION2011 Form10K
PART II
ITEM 8 Financial Statements and Supplementary Data
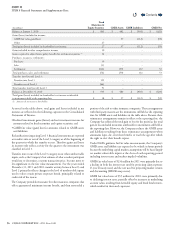
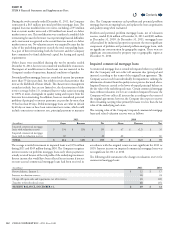
(In millions)
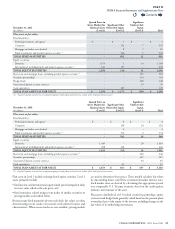
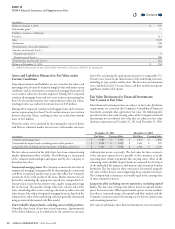
Balance at January1,2010 $ 550
Policyholder gains(1) 71
Purchases, issuances, settlements:
Purchases 211
Sales (145)
Settlements (76)
Total purchases, sales and settlements (10)
Transfers into/(out of) Level3:
Transfers into Level3 9
Transfers out of Level3 (26)
Total transfers into/(out of) Level3: (17)
Balance at December31,2010 $ 594
(1) Included in this amount are gains of $53million attributable to instruments still held at the reporting date.
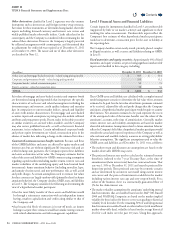
Assets and Liabilities Measured at Fair Value under
Certain Conditions
Some nancial assets and liabilities are not carried at fair value each
reporting period, but may be measured using fair value only under certain
conditions, such as investments in commercial mortgage loans and real
estate entities when they become impaired. During 2011, impaired
commercial mortgage loans and real estate entities representing less
than 1% of total investments were written down to their fair values,
resulting in after-tax realized investment losses of $15million.
During 2010, impaired commercial mortgage loans and real estate
entities representing less than 1% of total investments were written
down to their fair values, resulting in after-tax realized investment
losses of $25million.
ese fair values were calculated by discounting the expected future
cash ows at estimated market interest rates. Such market rates were
derived by calculating the appropriate spread over comparable U.S.
Treasury rates, based on the characteristics of the underlying real estate,
including its type, quality and location. e fair value measurements
were classied in Level3 because these cash ow models incorporate
signicant unobservable inputs.
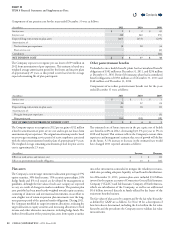
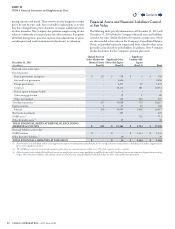
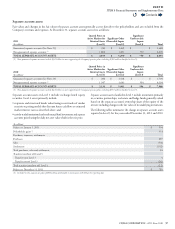
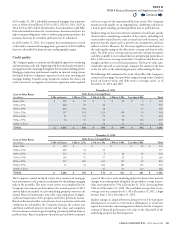
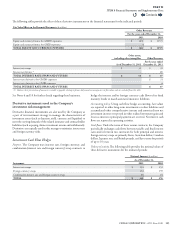
Fair Value Disclosures for Financial Instruments
Not Carried at Fair Value
Most nancial instruments that are subject to fair value disclosure
requirements are carried in the Company’s Consolidated Financial
Statements at amounts that approximate fair value. e following table
provides the fair values and carrying values of the Company’s nancial
instruments not recorded at fair value that are subject to fair value
disclosure requirements at December31,2011 and December31,2010.
(In millions)
December31,2011 December31,2010
Fair Value Carrying Value Fair Value Carrying Value
Commercial mortgage loans $ 3,380 $ 3,301 $ 3,470 $ 3,486
Contractholder deposit funds, excluding universal life products $ 1,056 $ 1,035 $ 1,001 $ 989
Long-term debt, including current maturities, excluding capital leases $ 5,281 $ 4,946 $ 2,926 $ 2,709
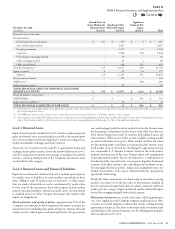
e fair values presented in the table above have been estimated using
market information when available. e following is a description
of the valuation methodologies and inputs used by the Company to
determine fair value.
Commercial mortgage loans. e Company estimates the fair value of
commercial mortgage loans generally by discounting the contractual
cash ows at estimated market interest rates that reect the Company’s
assessment of the credit quality of the loans. Market interest rates are
derived by calculating the appropriate spread over comparable U.S.
Treasury rates, based on the property type, quality rating and average
life of the loan. e quality ratings reect the relative risk of the
loan, considering debt service coverage, the loan-to-value ratio and
other factors. Fair values of impaired mortgage loans are based on the
estimated fair value of the underlying collateral generally determined
using an internal discounted cash ow model.
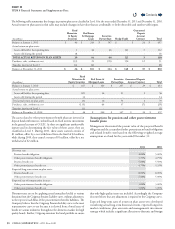
Contractholder deposit funds, excluding universal life products.
Generally, these funds do not have stated maturities. Approximately
50% of these balances can be withdrawn by the customer at any time
without prior notice or penalty. e fair value for these contracts
is the amount estimated to be payable to the customer as of the
reporting date, which is generally the carrying value. Most of the
remaining contractholder deposit funds are reinsured by the buyers
of the individual life insurance and annuity and retirement benets
businesses. e fair value for these contracts is determined using the
fair value of these buyers’ assets supporting these reinsured contracts.
e Company had a reinsurance recoverable equal to the carrying value
of these reinsured contracts.
Long-term debt, including current maturities, excluding capital
leases. e fair value of long-term debt is based on quoted market
prices for recent trades. When quoted market prices are not available,
fair value is estimated using a discounted cash ow analysis and the
Company’s estimated current borrowing rate for debt of similar terms
and remaining maturities.
Fair values of o-balance sheet nancial instruments were not material.
Contents
Q