Cigna 2011 Annual Report Download - page 78
Download and view the complete annual report
Please find page 78 of the 2011 Cigna annual report below. You can navigate through the pages in the report by either clicking on the pages listed below, or by using the keyword search tool below to find specific information within the annual report.-
 1
1 -
2
-
3
-
4
-
5
-
6
-
7
-
8
-
9
-
10
-
11
-
12
-
13
-
14
-
15
-
16
-
17
-
18
-
19
-
20
-
21
-
22
-
23
-
24
-
25
-
26
-
27
-
28
-
29
-
30
-
31
-
32
-
33
-
34
-
35
-
36
-
37
-
38
-
39
-
40
-
41
-
42
-
43
-
44
-
45
-
46
-
47
-
48
-
49
-
50
-
51
-
52
-
53
-
54
-
55
-
56
-
57
-
58
-
59
-
60
-
61
-
62
-
63
-
64
-
65
-
66
-
67
-
 68
68 -
 69
69 -
 70
70 -
 71
71 -
 72
72 -
 73
73 -
 74
74 -
 75
75 -
 76
76 -
 77
77 -
 78
78 -
 79
79 -
 80
80 -
 81
81 -
 82
82 -
 83
83 -
 84
84 -
 85
85 -
 86
86 -
 87
87 -
 88
88 -
89
-
90
-
91
-
92
-
93
-
94
-
95
-
96
-
97
-
98
-
99
-
100
-
101
-
102
-
103
-
104
-
105
-
106
-
107
-
108
-
109
-
110
-
111
-
112
-
113
-
114
-
115
-
116
-
117
-
118
-
119
-
120
-
121
-
122
-
123
-
124
-
125
-
126
-
127
-
128
-
129
-
130
-
131
-
132
-
133
-
134
-
135
-
136
-
137
-
138
-
139
-
140
-
141
-
142
-
143
-
144
-
145
-
146
-
147
-
148
-
149
-
150
-
151
-
152
-
153
-
154
-
155
-
156
-
157
-
158
-
159
-
160
-
161
-
162
-
163
-
164
-
165
-
166
-
167
-
168
-
169
-
170
-
171
-
172
-
173
-
174
-
175
-
176
-
177
-
178
-
179
-
180
 |
 |

56 CIGNA CORPORATION2011 Form10K
PART II
ITEM 7 Management’s Discussion and Analysis of Financial Condition and Results of Operations
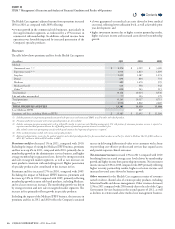
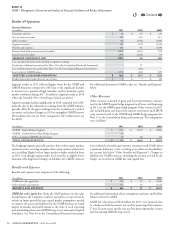
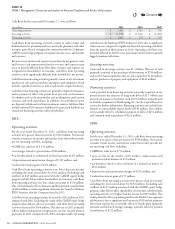
Cash ows for the years ended December31, were as follows:
(In millions)
2011 2010 2009
Operating activities $ 1,491 $ 1,743 $ 745
Investing activities $ (1,270) $ (1,342) $ (1,485)
Financing activities $ 2,867 $ 274 $ 307
Cash ows from operating activities consist of cash receipts and
disbursements for premiums and fees, mail order pharmacy and other
revenues, gains (losses) recognized in connection with the Company’s
GMDB equity hedge program, investment income, taxes, and benets
and expenses.
Because certain income and expense transactions do not generate cash,
and because cash transactions related to revenue and expenses may
occur in periods dierent from when those revenues and expenses are
recognized in shareholders’ net income, cash ows from operating
activities can be signicantly dierent from shareholders’ net income.
Cash ows from investing activities generally consist of net investment
purchases or sales and net purchases of property and equipment, which
includes capitalized software, as well as cash used to acquire businesses.
Cash ows from nancing activities are generally comprised of issuances
and re-payment of debt at the parent level, proceeds on the issuance
of common stock in the open market and resulting from stock option
exercises, and stock repurchases. In addition, the subsidiaries report
net deposits/withdrawals to/from investment contract liabilities (that
include universal life insurance liabilities) because such liabilities are
considered nancing activities with policyholders.
2011:
Operating activities
For the year ended December31,2011, cash ows from operating
activities were greater than net income by $163million. Net income
contains certain pre-tax income and expense items that neither provide
nor use operating cash ow, including:
•GMIB fair value loss of $ 234million;
•net charges related to special items of $40million;
•
tax benets related to resolution of a federal tax matter of $33million;
•depreciation and amortization charges of $ 345million; and
•realized investment gains of $ 62million.
Cash ows from operating activities were lower than net income
excluding the items noted above by $361million. Excluding cash
outows of $45million associated with the GMDB equity hedge
program (which did not aect shareholders’ net income), cash ows
from operating activities were lower than net income by $316million.
is result primarily reects domestic qualied pension contributions
of $250million as well as signicant claim run-out from the Medicare
IPFFS business, that the Company exited in 2011.
Cash ows from operating activities decreased by $252million in 2011
compared with 2010. Excluding the results of the GMDB equity hedge
program (that did not aect net income), cash ows from operating
activities decreased by $364million. is decrease in 2011 primarily
reects higher management compensation, income tax and pension
payments in 2011 compared with 2010 and unfavorable operating
cash ows in the Medicare IPFFS business in 2011 due to signicant
claim run-out compared to signicant favorable operating cash ows
from the growth of this business in 2010. Operating cash ows were
favorably aected in 2010 because paid claims on this business growth
lagged premium collections.
Investing activities
Cash used in investing activities was $1.3billion. is use of cash
primarily consisted of net purchases of investments of $746million,
cash used to fund acquisitions (net of cash acquired) of $114million,
and net purchases of property and equipment of $422million.
Financing activities
Cash provided from nancing activities primarily consisted of net
proceeds from the issuance of long-term debt of $2.7billion and
proceeds on issuances of common stock of $734million, primarily used
to fund the acquisition of Healthspring,Inc. See the Capital Resources
section for further information. Financing activities also included net
deposits to contractholder deposit funds of $145million. ese inows
were partially oset by scheduled payments of debt of $451million
and common stock repurchases of $225million.
2010:
Operating activities
For the year ended December31,2010, cash ows from operating
activities were greater than net income by $394million. Net income
contains certain income and expense items that neither provide nor
use operating cash ow, including:
•GMIB fair value loss of $ 55million;
•
a pre-tax loss on the transfer of the workers’ compensation and
personal accident business of $31million;
•
tax benets related to the resolution of a federal tax matter of
$101million;
•depreciation and amortization charges of $ 292million; and
•realized investment gains of $ 75million.
Cash ows from operating activities were greater than net income
excluding the items noted above by $192million. Excluding cash
outows of $157million associated with the GMDB equity hedge
program, (that did not aect shareholders’ net income) cash ows from
operating activities were higher than net income by $349million. is
result primarily reects premium growth in the Health Care segment’s
risk businesses due to signicant new business in 2010 and tax payments
lower than expense due to favorable eects of benet plans (primarily
pension) and deferred foreign earnings, partially oset by pension
contributions of $212million.
Contents
Q