CarMax 2011 Annual Report Download - page 83
Download and view the complete annual report
Please find page 83 of the 2011 CarMax annual report below. You can navigate through the pages in the report by either clicking on the pages listed below, or by using the keyword search tool below to find specific information within the annual report.-
 1
1 -
2
-
3
-
4
-
5
-
6
-
7
-
8
-
9
-
10
-
11
-
12
-
13
-
14
-
15
-
16
-
17
-
18
-
19
-
20
-
21
-
22
-
23
-
24
-
25
-
26
-
27
-
28
-
29
-
30
-
31
-
32
-
33
-
34
-
35
-
36
-
37
-
38
-
39
-
40
-
41
-
42
-
43
-
44
-
45
-
46
-
47
-
48
-
49
-
50
-
51
-
52
-
53
-
54
-
55
-
56
-
57
-
58
-
59
-
60
-
61
-
62
-
63
-
64
-
65
-
66
-
67
-
68
-
69
-
70
-
71
-
72
-
 73
73 -
 74
74 -
 75
75 -
 76
76 -
 77
77 -
 78
78 -
 79
79 -
 80
80 -
 81
81 -
 82
82 -
 83
83 -
 84
84 -
 85
85 -
 86
86 -
 87
87 -
 88
88 -
 89
89 -
 90
90 -
 91
91 -
 92
92 -
 93
93 -
94
-
95
-
96
-
97
-
98
-
99
-
100
 |
 |

73
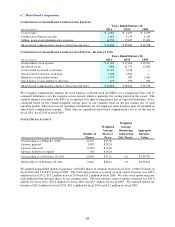
purchase 1,656,658 shares were not included. In fiscal 2010, options to purchase 5,425,666 shares were not
included. In fiscal 2009, options to purchase 8,340,996 shares were not included.
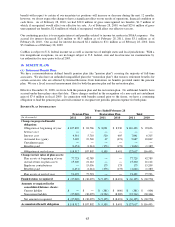
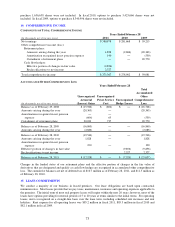
14. COMPREHENSIVE INCOME
COMPONENTS OF TOTAL COMPREHENSIVE INCOME
(In thousands, net of income taxes)
Net earnings 380,878$ 281,668$ 59,213$
Other comprehensive income (loss):
Retirement plans:
Amounts arising during the year 1,828 (2,686) (20,363)
Amortization recognized in net pension expense 190 ― (539)
Curtailment of retirement plans ― ― 20,770
Cash flow hedges:
Effective portion of changes in fair value (9,856)
Reclassifications to net income 2,327
Total comprehensive income 375,367$ 278,982$ 59,081$
Years Ended February 28
2011
2010
2009
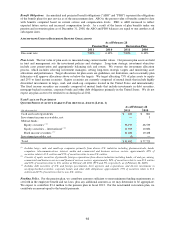
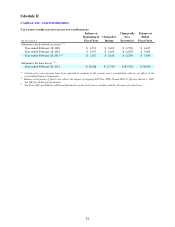
ACCUMULATED OTHER COMPREHENSIVE LOSS
Balance as of February 29, 2008 (15,926)$ (802)$ ―$ (16,728)$
Amounts arising during the year (20,363) ― (20,363)
― ―
(604) 65 (539)
Curtailment of retirement plans 20,033 737 20,770
Balance as of February 28, 2009 (16,860) ― ― (16,860)
Amounts arising during the year (2,686) ― (2,686)
Balance as of February 28, 2010 (19,546) ― ― (19,546)
Amounts arising during the year 1,828 ― 1,828
190 ― 190
Effective portion of changes in fair value (9,856) (9,856)
Reclassifications to net income 2,327 2,327
Balance as of February 28, 2011 (17,528)$ ―$ (7,529)$ (25,057)$
Amortization recognized in net pension
expense
Amortization recognized in net pension
expense
(In thousands, net of income taxes)
Unrecognized
Prior Service
Cost
Unrecognized
Hedge Losses
Total
Accumulated
Other
Comprehensive
Loss
Years Ended February 28
Unrecognized
Actuarial
(Losses) Gains
Changes in the funded status of our retirement plans and the effective portion of changes in the fair value of
derivatives that are designated and qualify as cash flow hedges are recognized in accumulated other comprehensive
loss. The cumulative balances are net of deferred tax of $10.7 million as of February 28, 2011, and $11.5 million as
of February 28, 2010.
15. LEASE COMMITMENTS
We conduct a majority of our business in leased premises. Our lease obligations are based upon contractual
minimum rates. Most leases provide that we pay taxes, maintenance, insurance and operating expenses applicable to
the premises. The initial term of most real property leases will expire within the next 20 years; however, most of the
leases have options providing for renewal periods of 5 to 20 years at terms similar to the initial terms. For operating
leases, rent is recognized on a straight-line basis over the lease term, including scheduled rent increases and rent
holidays. Rent expense for all operating leases was $85.2 million in fiscal 2011, $85.3 million in fiscal 2010 and
$82.1 million in fiscal 2009.