CarMax 2011 Annual Report Download - page 79
Download and view the complete annual report
Please find page 79 of the 2011 CarMax annual report below. You can navigate through the pages in the report by either clicking on the pages listed below, or by using the keyword search tool below to find specific information within the annual report.-
 1
1 -
2
-
3
-
4
-
5
-
6
-
7
-
8
-
9
-
10
-
11
-
12
-
13
-
14
-
15
-
16
-
17
-
18
-
19
-
20
-
21
-
22
-
23
-
24
-
25
-
26
-
27
-
28
-
29
-
30
-
31
-
32
-
33
-
34
-
35
-
36
-
37
-
38
-
39
-
40
-
41
-
42
-
43
-
44
-
45
-
46
-
47
-
48
-
49
-
50
-
51
-
52
-
53
-
54
-
55
-
56
-
57
-
58
-
59
-
60
-
61
-
62
-
63
-
64
-
65
-
66
-
67
-
68
-
 69
69 -
 70
70 -
 71
71 -
 72
72 -
 73
73 -
 74
74 -
 75
75 -
 76
76 -
 77
77 -
 78
78 -
 79
79 -
 80
80 -
 81
81 -
 82
82 -
 83
83 -
 84
84 -
 85
85 -
 86
86 -
 87
87 -
 88
88 -
 89
89 -
90
-
91
-
92
-
93
-
94
-
95
-
96
-
97
-
98
-
99
-
100
 |
 |

69
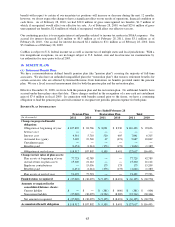
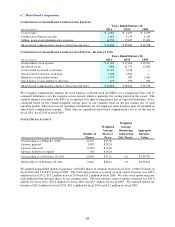
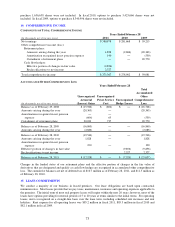
(C) Share-Based Compensation
COMPOSITION OF SHARE-BASED COMPENSATION EXPENSE
(In thousands)
Cost of sales 2,081$ 2,103$ 2,136$
CarMax Auto Finance income 1,603 1,334 1,181
Selling, general and administrative expenses 40,996 35,407 33,201
Share-based compensation expense, before income taxes 44,680$ 38,844$ 36,518$
Years Ended February 28
2011
2010
2009
COMPOSITION OF SHARE-BASED COMPENSATION EXPENSE – BY GRANT TYPE
(In thousands)
Nonqualified stock options 17,302$ 17,404$ 19,031$
Restricted stock 5,964 11,571 15,823
Cash-settled restricted stock units 13,917 5,718 ―
Stock-settled restricted stock units 5,948 2,614 ―
Employee stock purchase plan 1,074 987 1,081
Stock grants to non-employee directors 475 550 583
Share-based compensation expense, before income taxes 44,680$ 38,844$ 36,518$
2011
2010
2009
Years Ended February 28
We recognize compensation expense for stock options, restricted stock and MSUs on a straight-line basis (net of
estimated forfeitures) over the requisite service period, which is generally the vesting period of the award. The
variable expense associated with RSUs is recognized over their vesting period (net of expected forfeitures) and is
calculated based on the volume-weighted average price of our common stock on the last trading day of each
reporting period. The total costs for matching contributions for our employee stock purchase plan are included in
share-based compensation expense. There were no capitalized share-based compensation costs as of the end of
fiscal 2011, fiscal 2010 or fiscal 2009.
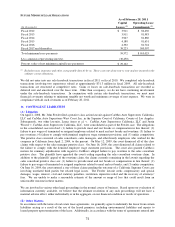
STOCK OPTION ACTIVITY
Outstanding as of March 1, 2010 13,741 15.58$
Options granted 1,893 25.29$
Options exercised (3,125) 14.60$
Options forfeited or expired (65) 14.24$
Outstanding as of February 28, 2011 12,444 17.31$ 4.2
$ 224,720
Exercisable as of February 28, 2011 6,922 16.12$ 3.4
$ 133,232
Weighted
Average
Exercise
Price
Weighted
Average
Remaining
Contractual
Life (Years)
(Shares and intrinsic value in thousands)
Number of
Shares
Aggregate
Intrinsic
Value
We granted nonqualified options to purchase 1,892,867 shares of common stock in fiscal 2011, 2,948,150 shares in
fiscal 2010 and 2,219,857 in fiscal 2009. The total cash received as a result of stock option exercises was $45.6
million in fiscal 2011, $35.2 million in fiscal 2010 and $10.2 million in fiscal 2009. We settle stock option exercises
with authorized but unissued shares of our common stock. The total intrinsic value of options exercised was $41.6
million for fiscal 2011, $25.8 million for fiscal 2010 and $5.7 million for fiscal 2009. We realized related tax
benefits of $16.5 million for fiscal 2011, $10.1 million for fiscal 2010 and $2.2 million for fiscal 2009.