CarMax 2011 Annual Report Download - page 82
Download and view the complete annual report
Please find page 82 of the 2011 CarMax annual report below. You can navigate through the pages in the report by either clicking on the pages listed below, or by using the keyword search tool below to find specific information within the annual report.-
 1
1 -
2
-
3
-
4
-
5
-
6
-
7
-
8
-
9
-
10
-
11
-
12
-
13
-
14
-
15
-
16
-
17
-
18
-
19
-
20
-
21
-
22
-
23
-
24
-
25
-
26
-
27
-
28
-
29
-
30
-
31
-
32
-
33
-
34
-
35
-
36
-
37
-
38
-
39
-
40
-
41
-
42
-
43
-
44
-
45
-
46
-
47
-
48
-
49
-
50
-
51
-
52
-
53
-
54
-
55
-
56
-
57
-
58
-
59
-
60
-
61
-
62
-
63
-
64
-
65
-
66
-
67
-
68
-
69
-
70
-
71
-
 72
72 -
 73
73 -
 74
74 -
 75
75 -
 76
76 -
 77
77 -
 78
78 -
 79
79 -
 80
80 -
 81
81 -
 82
82 -
 83
83 -
 84
84 -
 85
85 -
 86
86 -
 87
87 -
 88
88 -
 89
89 -
 90
90 -
 91
91 -
 92
92 -
93
-
94
-
95
-
96
-
97
-
98
-
99
-
100
 |
 |

72
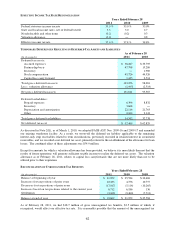
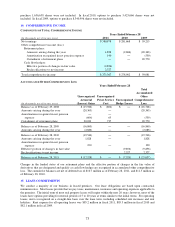
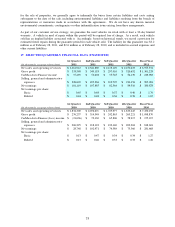
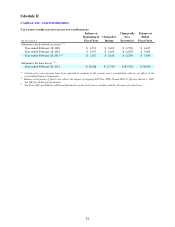
EXPECTED CASH SETTLEMENT RANGE UPON RESTRICTED STOCK UNIT VESTING
(In thousands)
Fiscal 2013 $ 6,926 $ 18,470
Fiscal 2014 10,610 28,293
Total expected cash settlements
$ 17,536 $ 46,763
Maximum (1)
Minimum (1)
As of February 28, 2011
(1) Net of estimated forfeitures
(D) Employee Stock Purchase Plan
We sponsor an employee stock purchase plan for all associates meeting certain eligibility criteria. Associate
contributions are limited to 10% of eligible compensation, up to a maximum of $7,500 per year. For each $1.00
contributed to the plan by associates, we match $0.15. We have authorized up to 8,000,000 shares of common stock
for the employee stock purchase plan. Shares are acquired through open-market purchases.
As of February 28, 2011, a total of 4,426,064 shares remained available under the plan. Shares purchased on the
open market on behalf of associates totaled 301,195 during fiscal 2011; 452,936 during fiscal 2010; and 677,944
during fiscal 2009. The average price per share for purchases under the plan was $25.80 in fiscal 2011, $16.71 in
fiscal 2010 and $12.22 in fiscal 2009. The total costs for matching contributions are included in share-based
compensation expense.
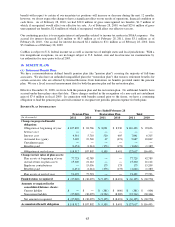
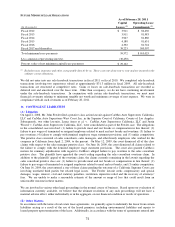
13. NET EARNINGS PER SHARE
On March 1, 2009, the company adopted the accounting pronouncement related to participating securities, with
retrospective application, which was subsequently integrated into the FASB ASC Topic 260, “Earnings Per Share.”
This pronouncement addresses whether instruments granted in share-based payment transactions are “participating
securities” prior to vesting, and therefore need to be included in the earnings allocation in computing net earnings
per share under the two-class method, as described in this pronouncement. Nonvested share-based payment awards
that contain nonforfeitable rights to dividends or dividend equivalents (whether paid or unpaid) are participating
securities and should be included in the computation of net earnings per share pursuant to the two-class method.
Our restricted stock awards are considered participating securities because they contain nonforfeitable rights to
dividends and are included in the computation of earnings per share pursuant to the two-class method. Nonvested
MSUs do not receive nonforfeitable dividend equivalent rights, and therefore, are not considered participating
securities. RSUs are nonparticipating, non-equity instruments, and therefore, are excluded from net earnings per
share calculations. The adoption had no impact on previously reported basic or diluted net earnings per share for
fiscal 2009.
BASIC AND DILUTIVE NET EARNINGS PER SHARE RECONCILIATIONS
(In thousands except per share data)
Net earnings 380,878$ 281,668$ 59,213$
Less net earnings allocable to restricted stock 1,638 2,377 703
Net earnings available for basic common shares 379,240 279,291 58,510
Adjustment for dilutive potential common shares 38 29 5
Net earnings available for diluted common shares 379,278$ 279,320$ 58,515$
Weighted average common shares outstanding 223,449 219,527 217,537
Dilutive potential common shares:
Stock options 3,540 2,415 1,820
Stock-settled restricted stock units 612 292 ―
Weighted average common shares and dilutive potential
common shares 227,601 222,234 219,357
Basic net earnings per share 1.70$ 1.27$ 0.27$
Diluted net earnings per share 1.67$ 1.26$ 0.27$
Years Ended February 28
2011
2009
2010
Certain weighted-average options to purchase shares of common stock were outstanding and not included in the
calculation of diluted net earnings per share because their inclusion would be antidilutive. In fiscal 2011, options to