CarMax 2011 Annual Report Download - page 34
Download and view the complete annual report
Please find page 34 of the 2011 CarMax annual report below. You can navigate through the pages in the report by either clicking on the pages listed below, or by using the keyword search tool below to find specific information within the annual report.-
 1
1 -
2
-
3
-
4
-
5
-
6
-
7
-
8
-
9
-
10
-
11
-
12
-
13
-
14
-
15
-
16
-
17
-
18
-
19
-
20
-
21
-
22
-
23
-
 24
24 -
 25
25 -
 26
26 -
 27
27 -
 28
28 -
 29
29 -
 30
30 -
 31
31 -
 32
32 -
 33
33 -
 34
34 -
 35
35 -
 36
36 -
 37
37 -
 38
38 -
 39
39 -
 40
40 -
 41
41 -
 42
42 -
 43
43 -
 44
44 -
45
-
46
-
47
-
48
-
49
-
50
-
51
-
52
-
53
-
54
-
55
-
56
-
57
-
58
-
59
-
60
-
61
-
62
-
63
-
64
-
65
-
66
-
67
-
68
-
69
-
70
-
71
-
72
-
73
-
74
-
75
-
76
-
77
-
78
-
79
-
80
-
81
-
82
-
83
-
84
-
85
-
86
-
87
-
88
-
89
-
90
-
91
-
92
-
93
-
94
-
95
-
96
-
97
-
98
-
99
-
100
 |
 |
24
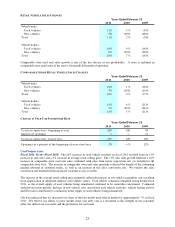
Fiscal 2010 Versus Fiscal 2009. The 9% increase in used vehicle revenues in fiscal 2010 resulted from a 5%
increase in average retail selling price and a 3% increase in unit sales. The increase in the average retail selling
price primarily reflected the effect of higher used vehicle wholesale valuations on our vehicle acquisition costs.
After falling sharply in fiscal 2009, wholesale vehicle values climbed during much of fiscal 2010, which we believe
in part reflected tight supply conditions that occurred as vehicle trade-in activity slowed in tandem with the decline
in new car industry sales.
The 3% unit sales growth reflected a 1% increase in comparable store used unit sales and sales from newer
superstores not yet included in the comparable store base. We experienced a significant improvement in sales
execution in fiscal 2010; however, the resulting increase in sales conversion rate was almost fully offset by a decline
in customer traffic. The improvement in sales conversion occurred despite the tightening of lending standards by
our third-party financing providers and CAF in fiscal 2010, which we estimate adversely affected our comparable
store used unit sales growth by several percentage points. Continuing weak economic conditions caused our
customer traffic to remain below the prior year level, despite the fact that the government’s Consumer Assistance to
Recycle and Save Act (“CARS” or “cash for clunkers”) new car incentive program generated a spike in traffic in
late July and August 2009. Similar to our experience with previous successful, broad-based new car incentive
programs, we believe this program had a beneficial effect on our used car customer traffic and sales.
Our data indicated that we increased our share of the late-model used vehicle market by more than 10% in fiscal
2010, while the overall market contracted.
New Vehicle Sales
As of February 28, 2011, we had a total of five new car franchises representing the Chrysler, Nissan and Toyota
brands. In June 2009, we were notified by General Motors that our Chevrolet franchise in Kenosha, Wisconsin,
would be terminated. During the third quarter of fiscal 2011, we stopped selling new General Motors vehicles at
this site, where we also have a used car superstore and a Toyota franchise. This franchise termination did not have a
material effect on sales or earnings.
Fiscal 2011 Versus Fiscal 2010. New vehicle revenues increased 6% in fiscal 2011 due to a 5% rise in unit sales
and a 2% increase in average retail selling price. The growth in our unit sales was achieved against a backdrop of
improving new vehicle industry sales. Based on industry data, new light vehicle industry sales increased 13% to
11.9 million units from 10.5 million units in fiscal 2010; although, they remained significantly below the 16 million
to 17 million unit range routinely achieved between 2000 and 2007. The wind down of our Chevrolet franchise,
which was one of many franchises terminated by General Motors, partially offset the growth in our new vehicle unit
sales.
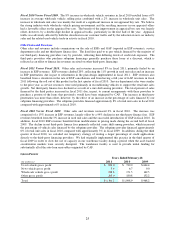
Fiscal 2010 Versus Fiscal 2009. New vehicle revenues declined 29% in fiscal 2010. The decrease was entirely the
result of a corresponding decline in unit sales, which primarily reflected the extremely soft new car industry sales
trends for the brands we represent. Based on industry data, new light vehicle industry sales declined 15% to
10.5 million units from 12.3 million units in fiscal 2009. A reduction in sales volumes at our Chevrolet franchise
following General Motors’ termination announcement also contributed to the decline in new vehicle unit sales.
While new vehicle sales volumes in the second quarter of fiscal 2010 benefitted from the cash for clunkers program,
we believe the effect on the full year was less material, as this program primarily shifted new vehicle demand into
the second fiscal quarter from the first and third quarters.
Wholesale Vehicle Sales
Our operating strategy is to build customer satisfaction by offering high-quality vehicles. Fewer than half of the
vehicles acquired from consumers through the appraisal purchase process meet our standards for reconditioning and
subsequent retail sale. Those vehicles that do not meet our standards are sold through on-site wholesale auctions.
Our wholesale auction prices usually reflect the trends in the general wholesale market for the types of vehicles we
sell, although they can also be affected by changes in vehicle mix or the average age, mileage or condition of the
vehicles wholesaled.
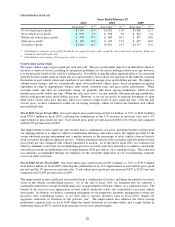
Fiscal 2011 Versus Fiscal 2010. The 54% increase in wholesale vehicle revenues in fiscal 2011 resulted from a
33% increase in wholesale unit sales combined with a 16% increase in average wholesale vehicle selling price. The
growth in unit sales reflected strong increases in both appraisal traffic and our appraisal buy rate. Our appraisal
traffic benefited from the increase in customer traffic in our stores and from the lift in new car industry sales and
related used vehicle trade-in activity in fiscal 2011. We believe the strong wholesale pricing environment and the
resulting increases in our appraisal offers had a favorable effect on the appraisal buy rate.