CarMax 2011 Annual Report Download - page 42
Download and view the complete annual report
Please find page 42 of the 2011 CarMax annual report below. You can navigate through the pages in the report by either clicking on the pages listed below, or by using the keyword search tool below to find specific information within the annual report.-
 1
1 -
2
-
3
-
4
-
5
-
6
-
7
-
8
-
9
-
10
-
11
-
12
-
13
-
14
-
15
-
16
-
17
-
18
-
19
-
20
-
21
-
22
-
23
-
24
-
25
-
26
-
27
-
28
-
29
-
30
-
31
-
 32
32 -
 33
33 -
 34
34 -
 35
35 -
 36
36 -
 37
37 -
 38
38 -
 39
39 -
 40
40 -
 41
41 -
 42
42 -
 43
43 -
 44
44 -
 45
45 -
 46
46 -
 47
47 -
 48
48 -
 49
49 -
 50
50 -
 51
51 -
 52
52 -
53
-
54
-
55
-
56
-
57
-
58
-
59
-
60
-
61
-
62
-
63
-
64
-
65
-
66
-
67
-
68
-
69
-
70
-
71
-
72
-
73
-
74
-
75
-
76
-
77
-
78
-
79
-
80
-
81
-
82
-
83
-
84
-
85
-
86
-
87
-
88
-
89
-
90
-
91
-
92
-
93
-
94
-
95
-
96
-
97
-
98
-
99
-
100
 |
 |
32
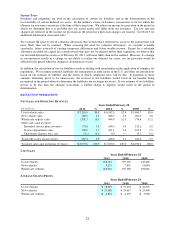
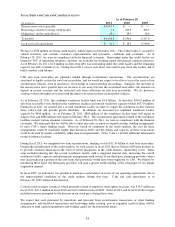
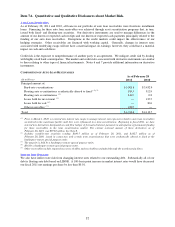
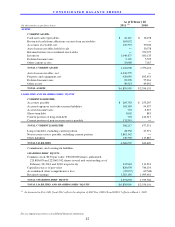
so were more favorable than selling them. Retained subordinated bonds were included in retained interest in
securitized receivables on our consolidated balance sheets, and their total fair value was $248.8 million as of
February 28, 2010, and $87.4 million as of February 28, 2009. Changes in the fair value of the retained
subordinated bonds were reflected in CAF income.
Fiscal 2010 Versus Fiscal 2009. CAF income increased to $175.2 million from $15.3 million in fiscal 2009. In
both periods, CAF results were affected by adjustments related to loans originated in previous fiscal years. In fiscal
2010, the adjustments increased CAF income by $26.7 million, or $0.07 per share, while in fiscal 2009, the
adjustments reduced CAF income by $81.8 million, or $0.23 per share.
The fiscal 2010 adjustments included $64.0 million of favorable mark-to-market adjustments primarily on retained
subordinated bonds and $18.9 million of net favorable valuation adjustments, partially offset by a $56.2 million
increase in funding costs related to auto loans originated in prior fiscal years. The fiscal 2009 adjustments included
$32.0 million of unfavorable mark-to-market adjustments on retained subordinated bonds, $31.8 million of net
unfavorable valuation adjustments and an $18.0 million increase in funding costs related to auto loans originated in
prior fiscal years.
Excluding these adjustments from both periods, CAF income increased to $148.6 million from $97.0 million in
fiscal 2009. CAF’s gain on loans originated and sold climbed to $83.0 million from $46.5 million in fiscal 2009.
Several factors contributed to this improvement. The spread between the rates charged customers and CAF’s
funding costs increased, largely due to lower benchmark rates. In addition, CAF’s tightening of lending standards
had a favorable effect on the expected net loss and discount rate assumptions used to value the related gain income
and on the required credit enhancements. The volume of CAF loans originated declined 4% to $1.84 billion from
$1.91 billion in fiscal 2009, mainly reflecting a decline in the percentage of sales financed by CAF. CAF’s
penetration rate fell to 30% from 33% in fiscal 2009, primarily reflecting CAF’s tightening of lending standards.
The increases in servicing fee income and direct CAF expenses in fiscal 2010 were proportionate to the growth in
average managed receivables, principal only. The interest income component of other CAF income, which
increased to 1.7% of average managed receivables, principal only, from 1.2% in fiscal 2009, included the interest
earned on the retained subordinated bonds. This growth in interest income primarily resulted from our increased
holdings of retained subordinated bonds and higher yields on subordinated bonds retained in connection with the
April 2009 securitization.
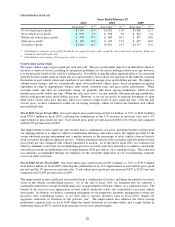
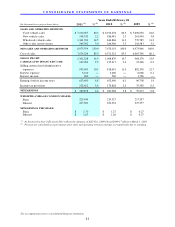
Selling, General and Administrative Expenses
SG&A expenses primarily include payroll expenses, other than payroll related to reconditioning and vehicle repair
service, which is included in cost of sales; fringe benefits; rent and occupancy costs; advertising; and other general
expenses.
Fiscal 2011 Versus Fiscal 2010. SG&A expenses increased 11% to $905.1 million from $818.7 million in fiscal
2010. The increase in SG&A primarily reflected increases in sales commissions and other variable costs associated
with the growth in unit sales and higher advertising costs, as well as costs associated with our resumption of store
growth. The increase also reflected the absence of a favorable litigation settlement included in SG&A in the prior
year, which increased fiscal 2010 net earnings by $0.02 per share. The SG&A ratio improved to 10.1% from 11.0%
in fiscal 2010, reflecting the leverage associated with the increases in retail and wholesale unit sales and average
selling prices.
Fiscal 2010 Versus Fiscal 2009. SG&A expenses were reduced 7% to $818.7 million from $882.4 million in fiscal
2009, despite the increase in unit sales in fiscal 2010. Given the weak environment experienced in the previous two
years, we felt it was prudent to take a particularly cautious approach to SG&A spending during fiscal 2010.
Accordingly, we made significant curtailments in advertising, implemented a wage freeze for all salaried and hourly
associates and a hiring freeze at our home office, reduced our management bench strength and deferred
developmental and discretionary project spending. The SG&A expense reduction also reflected decreases in
growth-related costs, including pre-opening and relocation costs, resulting from the suspension of store growth, as
well as benefits from a variety of waste-reduction initiatives. The SG&A ratio fell to 11.0% from 12.7% in fiscal
2009 primarily due to the reduction in SG&A expenses and the leverage associated with the increases in average
selling prices and unit sales.
The fiscal 2010 SG&A expenses included the benefit of a favorable litigation settlement, which increased net
earnings by $0.02 per share, while the fiscal 2009 SG&A expenses included various non-recurring items, which in
the aggregate reduced net earnings by a total of $0.04 per share.