CarMax 2011 Annual Report Download - page 41
Download and view the complete annual report
Please find page 41 of the 2011 CarMax annual report below. You can navigate through the pages in the report by either clicking on the pages listed below, or by using the keyword search tool below to find specific information within the annual report.-
 1
1 -
2
-
3
-
4
-
5
-
6
-
7
-
8
-
9
-
10
-
11
-
12
-
13
-
14
-
15
-
16
-
17
-
18
-
19
-
20
-
21
-
22
-
23
-
24
-
25
-
26
-
27
-
28
-
29
-
30
-
 31
31 -
 32
32 -
 33
33 -
 34
34 -
 35
35 -
 36
36 -
 37
37 -
 38
38 -
 39
39 -
 40
40 -
 41
41 -
 42
42 -
 43
43 -
 44
44 -
 45
45 -
 46
46 -
 47
47 -
 48
48 -
 49
49 -
 50
50 -
 51
51 -
52
-
53
-
54
-
55
-
56
-
57
-
58
-
59
-
60
-
61
-
62
-
63
-
64
-
65
-
66
-
67
-
68
-
69
-
70
-
71
-
72
-
73
-
74
-
75
-
76
-
77
-
78
-
79
-
80
-
81
-
82
-
83
-
84
-
85
-
86
-
87
-
88
-
89
-
90
-
91
-
92
-
93
-
94
-
95
-
96
-
97
-
98
-
99
-
100
 |
 |

31
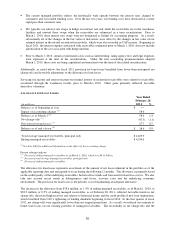
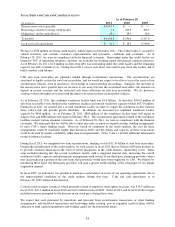
resulting adjustment to the allowance for loan losses positively affected fiscal 2011 net income by approximately
$0.03 per share versus our expectations.
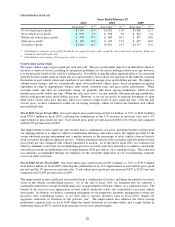
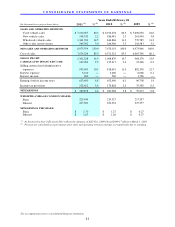
PAST DUE ACCOUNT INFORMATION
(In millions)
Accounts 31+ days past due 121.3$ 133.2$ 118.1$
Ending managed receivables 4,334.6$ 4,112.7$ 3,986.7$
Past due accounts as a percentage of ending managed
receivables
2.80% 3.24% 2.96%
2011
As of February 28
2010
2009
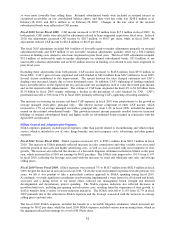
CREDIT LOSS INFORMATION
(In millions)
Net credit losses on managed receivables 47.5$ 70.1$ 69.8$
Total average managed receivables, principal only 4,229.9$ 4,057.2$ 3,998.4$
Net credit losses as a percentage of total average
managed receivables, principal only 1.12% 1.73% 1.75%
Average recovery rate 54.8% 49.8% 44.0%
2011
2010
2009
Years Ended February 28
In fiscal 2011, we experienced improvements in both past due accounts as a percentage of ending managed
receivables and net credit losses as a percentage of total average managed receivables, principal only. We believe
the improvements were the result of several factors including our credit tightening implemented in fiscal 2010, the
strong recovery rates and general industry trends for losses and delinquencies.
The average recovery rate represents the average percentage of the outstanding principal balance we receive when a
vehicle is repossessed and liquidated at wholesale auction. Historically, the annual recovery rate has ranged from a
low of 42% to a high of 55%, and it is primarily affected by changes in the wholesale market pricing environment.
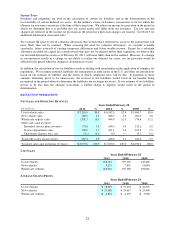
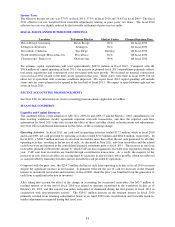
CAF SUPPLEMENTAL ORIGINATION INFORMATION
Net loans originated (2) 2,147.4$ 1,836.9$ 1,905.4$
Vehicle units financed 120,183 109,030 116,733
Penetration rate (3) 29.7% 29.9% 32.7%
Weighted average contract rate 8.7% 9.5% 10.3%
Weighted average term (4) 64.5 64.2 63.8
Years Ended February 28 (1)
2011
2010
2009
(1) All information relates to loans originated net of estimated 3-day payoffs and vehicle returns.
(2) In millions.
(3) Vehicle units financed as a percentage of total retail units sold.
(4) In months.
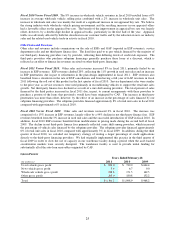
Fiscal 2010 and Prior Years. Prior to March 1, 2010, securitization transactions were accounted for as sales. A
gain, recorded at the time of securitization, resulted from recording a receivable approximately equal to the present
value of the expected residual cash flows generated by the securitized receivables. The gain on sales of loans
originated and sold included both the gain income recorded at the time of securitization and the effect of any
subsequent changes in valuation assumptions or funding costs that were incurred in the same fiscal period that the
loans were originated. Other gains or losses included the effects of changes in valuation assumptions or funding
costs related to loans originated and sold during previous fiscal periods. In addition, other gains or losses included
the effects of new term securitizations, changes in the valuation of retained subordinated bonds and the repurchase
and resale of receivables in existing term securitizations, as applicable. Other income consisted of servicing fee
income on securitized receivables and interest income. Interest income included the effective yield on the retained
interest, as well as interest income earned on the retained subordinated bonds.
Between January 2008 and April 2009, we retained some or all of the subordinated bonds associated with our term
securitizations. We retained these subordinated bonds because, at the applicable issue date, the economics of doing