CarMax 2011 Annual Report Download - page 36
Download and view the complete annual report
Please find page 36 of the 2011 CarMax annual report below. You can navigate through the pages in the report by either clicking on the pages listed below, or by using the keyword search tool below to find specific information within the annual report.-
 1
1 -
2
-
3
-
4
-
5
-
6
-
7
-
8
-
9
-
10
-
11
-
12
-
13
-
14
-
15
-
16
-
17
-
18
-
19
-
20
-
21
-
22
-
23
-
24
-
25
-
 26
26 -
 27
27 -
 28
28 -
 29
29 -
 30
30 -
 31
31 -
 32
32 -
 33
33 -
 34
34 -
 35
35 -
 36
36 -
 37
37 -
 38
38 -
 39
39 -
 40
40 -
 41
41 -
 42
42 -
 43
43 -
 44
44 -
 45
45 -
 46
46 -
47
-
48
-
49
-
50
-
51
-
52
-
53
-
54
-
55
-
56
-
57
-
58
-
59
-
60
-
61
-
62
-
63
-
64
-
65
-
66
-
67
-
68
-
69
-
70
-
71
-
72
-
73
-
74
-
75
-
76
-
77
-
78
-
79
-
80
-
81
-
82
-
83
-
84
-
85
-
86
-
87
-
88
-
89
-
90
-
91
-
92
-
93
-
94
-
95
-
96
-
97
-
98
-
99
-
100
 |
 |

26
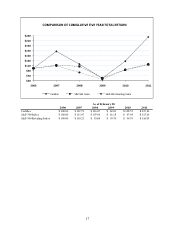
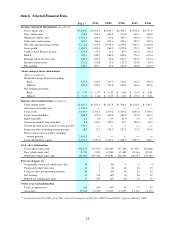
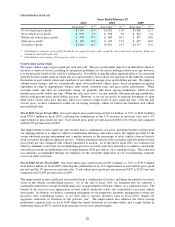
GROSS PROFIT PER UNIT
%(2) %(2) %(2)
Used vehicle gross profit 2,156$ 11.8 2,072$ 11.9 1,865$ 11.3
New vehicle gross profit 659$ 2.7 858$ 3.6 814$ 3.4
Wholesale vehicle gross profit 908$ 18.3 869$ 20.3 837$ 20.8
Other gross profit 502$ 76.5 495$ 73.3 427$ 63.0
Total gross profit 3,218$ 14.5 3,011$ 14.7 2,715$ 13.9
Years Ended February 28
2011
2010
2009
$ per unit (1)
$ per unit (1)
$ per unit (1)
(1) Calculated as category gross profit divided by its respective units sold, except the other and total categories, which are
divided by total retail units sold.
(2) Calculated as a percentage of its respective sales or revenue.
Used Vehicle Gross Profit
We target a dollar range of gross profit per used unit sold. The gross profit dollar target for an individual vehicle is
based on a variety of factors, including its anticipated probability of sale and its mileage relative to its age; however,
it is not primarily based on the vehicle’s selling price. Our ability to quickly adjust appraisal offers to be consistent
with the broader market trade-in trends and our rapid inventory turns reduce our exposure to the inherent continual
fluctuation in used vehicle values and contribute to our ability to manage gross profit dollars per unit. We employ a
volume-based strategy, and we systematically mark down individual vehicle prices based on proprietary pricing
algorithms in order to appropriately balance sales trends, inventory turns and gross profit achievement. When
customer traffic and sales are consistently strong, we generally take fewer pricing markdowns, which in turn
benefits gross profit dollars per unit. When the sales pace slows, we may initially take more pricing markdowns,
which could pressure gross profit dollars per unit. However, as we are successful in reducing inventories to align
them with a slower sales pace, this may allow us to return to target levels of gross profit per unit. Over the past
several years, we have continued to refine our car-buying strategies, which we believe has benefited used vehicle
gross profit per unit.
Fiscal 2011 Versus Fiscal 2010. Our used vehicle gross profit increased $114.2 million, or 15%, to $854.0 million
from $739.9 million in fiscal 2010, reflecting the combination of the 11% increase in used unit sales and a 4%
improvement in gross profit per unit. Used vehicle gross profit per unit increased $84 to $2,156 per unit compared
with $2,072 per unit in fiscal 2010.
The improvement in gross profit per unit resulted from a combination of factors, including benefits realized from
our ongoing initiatives to improve vehicle reconditioning efficiency and reduce waste, the support provided by the
strong wholesale pricing environment and a modest increase in the percentage of retail vehicles sourced directly
from consumers through our appraisal process. Vehicles purchased directly from consumers typically generate more
gross profit per unit compared with vehicles purchased at auction. As of the end of fiscal 2011, we estimated our
efforts to eliminate waste from our reconditioning processes in recent years have allowed us to achieve a sustainable
reduction in average reconditioning costs of approximately $250 per vehicle, on a cumulative basis. This reduction
was primarily accomplished through our emphasis on the consistent application of our reconditioning standards
across our entire store base.
Fiscal 2010 Versus Fiscal 2009. Our used vehicle gross profit increased $95.4 million, or 15%, to $739.9 million
from $644.4 million in fiscal 2009, reflecting the combination of an 11% improvement in used vehicle gross profit
per unit and the 3% increase in used unit sales. Used vehicle gross profit per unit increased $207 to $2,072 per unit
compared with $1,865 per unit in fiscal 2009.
The improvement in gross profit per unit resulted from a combination of factors, including our initiative to reduce
waste in the vehicle reconditioning process. As of the end of fiscal 2010, we estimated that we achieved a
sustainable reduction in average reconditioning costs of approximately $200 per vehicle, on a cumulative basis. The
benefit of the year-over-year appreciation in used vehicle wholesale values also contributed to our used vehicle
gross profit. In addition, we believe continuing refinements to our proprietary inventory management systems and
processes were contributing factors, as we were able to increase inventory turns in fiscal 2010, despite our
aggressive reductions in inventory in the previous year. The improvement also reflected the below-average
profitability reported early in fiscal 2009 when the initial slowdown in customer traffic and a rapid decline in
underlying values of SUVs and trucks put pressure on our used vehicle margins.