CarMax 2011 Annual Report Download - page 61
Download and view the complete annual report
Please find page 61 of the 2011 CarMax annual report below. You can navigate through the pages in the report by either clicking on the pages listed below, or by using the keyword search tool below to find specific information within the annual report.-
 1
1 -
2
-
3
-
4
-
5
-
6
-
7
-
8
-
9
-
10
-
11
-
12
-
13
-
14
-
15
-
16
-
17
-
18
-
19
-
20
-
21
-
22
-
23
-
24
-
25
-
26
-
27
-
28
-
29
-
30
-
31
-
32
-
33
-
34
-
35
-
36
-
37
-
38
-
39
-
40
-
41
-
42
-
43
-
44
-
45
-
46
-
47
-
48
-
49
-
50
-
 51
51 -
 52
52 -
 53
53 -
 54
54 -
 55
55 -
 56
56 -
 57
57 -
 58
58 -
 59
59 -
 60
60 -
 61
61 -
 62
62 -
 63
63 -
 64
64 -
 65
65 -
 66
66 -
 67
67 -
 68
68 -
 69
69 -
 70
70 -
 71
71 -
72
-
73
-
74
-
75
-
76
-
77
-
78
-
79
-
80
-
81
-
82
-
83
-
84
-
85
-
86
-
87
-
88
-
89
-
90
-
91
-
92
-
93
-
94
-
95
-
96
-
97
-
98
-
99
-
100
 |
 |

51
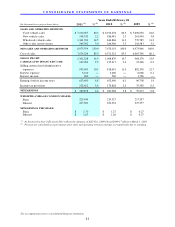
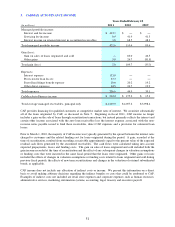
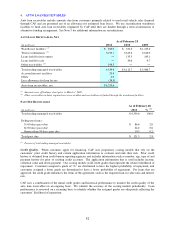
3. CARMAX AUTO FINANCE INCOME
(In millions)
Managed portfolio income:
Interest and fee income
$ 419.1 $ ― $ ―
Servicing fee income
0.9 41.9 41.3
Interest income on retained interest in securitized receivables
1.6 68.5 48.3
Total managed portfolio income
421.6 110.4 89.6
Gain (loss):
Gain on sales of loans originated and sold
― 83.0 46.5
Other gains
5.0 26.7 (81.8)
Total gain (loss)
5.0 109.7 (35.3)
Expenses:
Interest expense
133.8 ― ―
Provision for loan losses
27.7 ― ―
Payroll and fringe benefit expense
20.6 20.2 19.2
Other direct expenses
24.5 24.7 19.9
Total expenses
206.6 44.9 39.1
CarMax Auto Finance income
$ 220.0 $ 175.2 $ 15.3
Total average managed receivables, principal only
$ 4,229.9 $ 4,057.2 $ 3,998.4
Years Ended February 28
2011
2010
2009
CAF provides financing for qualified customers at competitive market rates of interest. We securitize substantially
all of the loans originated by CAF, as discussed in Note 5. Beginning in fiscal 2011, CAF income no longer
includes a gain on the sale of loans through securitization transactions, but instead primarily reflects the interest and
certain other income associated with the auto loan receivables less the interest expense associated with the non-
recourse notes payable issued to fund these receivables, direct CAF expenses and a provision for estimated loan
losses.
Prior to March 1, 2010, the majority of CAF income was typically generated by the spread between the interest rates
charged to customers and the related funding cost for loans originated during the period. A gain, recorded at the
time of securitization, resulted from recording a receivable approximately equal to the present value of the expected
residual cash flows generated by the securitized receivables. The cash flows were calculated taking into account
expected prepayments, losses and funding costs. The gain on sales of loans originated and sold included both the
gain income recorded at the time of securitization and the effect of any subsequent changes in valuation assumptions
or funding costs that were incurred in the same fiscal period that the loans were originated. Other gains or losses
included the effects of changes in valuation assumptions or funding costs related to loans originated and sold during
previous fiscal periods, the effects of new term securitizations and changes in the valuation of retained subordinated
bonds, as applicable.
CAF income does not include any allocation of indirect costs or income. We present this information on a direct
basis to avoid making arbitrary decisions regarding the indirect benefits or costs that could be attributed to CAF.
Examples of indirect costs not included are retail store expenses and corporate expenses such as human resources,
administrative services, marketing, information systems, accounting, legal, treasury and executive payroll.