CarMax 2011 Annual Report Download - page 62
Download and view the complete annual report
Please find page 62 of the 2011 CarMax annual report below. You can navigate through the pages in the report by either clicking on the pages listed below, or by using the keyword search tool below to find specific information within the annual report.-
 1
1 -
2
-
3
-
4
-
5
-
6
-
7
-
8
-
9
-
10
-
11
-
12
-
13
-
14
-
15
-
16
-
17
-
18
-
19
-
20
-
21
-
22
-
23
-
24
-
25
-
26
-
27
-
28
-
29
-
30
-
31
-
32
-
33
-
34
-
35
-
36
-
37
-
38
-
39
-
40
-
41
-
42
-
43
-
44
-
45
-
46
-
47
-
48
-
49
-
50
-
51
-
 52
52 -
 53
53 -
 54
54 -
 55
55 -
 56
56 -
 57
57 -
 58
58 -
 59
59 -
 60
60 -
 61
61 -
 62
62 -
 63
63 -
 64
64 -
 65
65 -
 66
66 -
 67
67 -
 68
68 -
 69
69 -
 70
70 -
 71
71 -
 72
72 -
73
-
74
-
75
-
76
-
77
-
78
-
79
-
80
-
81
-
82
-
83
-
84
-
85
-
86
-
87
-
88
-
89
-
90
-
91
-
92
-
93
-
94
-
95
-
96
-
97
-
98
-
99
-
100
 |
 |

52
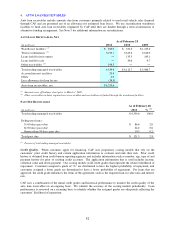
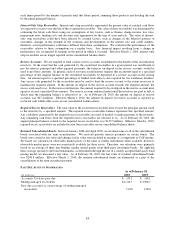
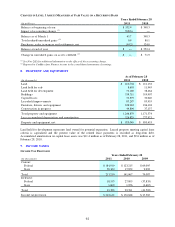
4. AUTO LOAN RECEIVABLES
Auto loan receivables include amounts due from customers primarily related to used retail vehicle sales financed
through CAF and are presented net of an allowance for estimated loan losses. We use securitization warehouse
facilities to fund auto loan receivables originated by CAF until they are funded through a term securitization or
alternative funding arrangement. See Note 5 for additional information on securitizations.
AUTO LOAN RECEIVABLES, NET
(In millions) 2011 2010 2009
Warehouse facilities (1) 943.0$ 331.0$ 1,215.0$
Term securitizations (1) 3,193.1 3,615.6 2,616.9
Loans held for investment ― 135.5 145.1
Loans held for sale ― 30.6 9.7
Other receivables (2) 198.5 ― ―
Total ending managed receivables 4,334.6 4,112.7$ 3,986.7$
Accrued interest and fees 20.9
Other 4.0
Less allowance for loan losses (38.9)
Auto loan receivables, net 4,320.6$
As of February 28
(1) Amounts were off-balance sheet prior to March 1, 2010.
(2) Other receivables includes required excess receivables and receivables not funded through the warehouse facilities.
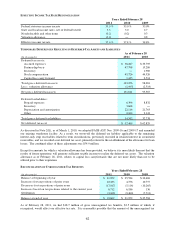
PAST DUE RECEIVABLES
(In millions)
% (1)
Total ending managed receivables 4,334.6$ 100.0
Delinquent loans:
31-60 days past due 86.6$ 2.0
61-90 days past due 24.2 0.6
Greater than 90 days past due 10.5 0.2
Total past due 121.3$ 2.8
2011
As of February 28
(1) Percent of total ending managed receivables.
Credit Quality. When customers apply for financing, CAF uses proprietary scoring models that rely on the
customers’ prior credit history and certain application information to evaluate and rank their risk. Prior credit
history is obtained from credit bureau reporting agencies and includes information such as number, age, type of and
payment history for prior or existing credit accounts. The application information that is used includes income,
collateral value and down payment. Our scoring models yield credit grades that represent the relative likelihood of
repayment. Customers assigned a grade of “A” are determined to have the highest probability of repayment, and
customers assigned a lower grade are determined to have a lower probability of repayment. For loans that are
approved, the credit grade influences the terms of the agreement, such as the required loan-to-value ratio and interest
rate.
CAF uses a combination of the initial credit grades and historical performance to monitor the credit quality of the
auto loan receivables on an ongoing basis. We validate the accuracy of the scoring models periodically. Loan
performance is reviewed on a recurring basis to identify whether the assigned grades are adequately reflecting the
customers’ likelihood of repayment.