CarMax 2011 Annual Report Download - page 35
Download and view the complete annual report
Please find page 35 of the 2011 CarMax annual report below. You can navigate through the pages in the report by either clicking on the pages listed below, or by using the keyword search tool below to find specific information within the annual report.-
 1
1 -
2
-
3
-
4
-
5
-
6
-
7
-
8
-
9
-
10
-
11
-
12
-
13
-
14
-
15
-
16
-
17
-
18
-
19
-
20
-
21
-
22
-
23
-
24
-
 25
25 -
 26
26 -
 27
27 -
 28
28 -
 29
29 -
 30
30 -
 31
31 -
 32
32 -
 33
33 -
 34
34 -
 35
35 -
 36
36 -
 37
37 -
 38
38 -
 39
39 -
 40
40 -
 41
41 -
 42
42 -
 43
43 -
 44
44 -
 45
45 -
46
-
47
-
48
-
49
-
50
-
51
-
52
-
53
-
54
-
55
-
56
-
57
-
58
-
59
-
60
-
61
-
62
-
63
-
64
-
65
-
66
-
67
-
68
-
69
-
70
-
71
-
72
-
73
-
74
-
75
-
76
-
77
-
78
-
79
-
80
-
81
-
82
-
83
-
84
-
85
-
86
-
87
-
88
-
89
-
90
-
91
-
92
-
93
-
94
-
95
-
96
-
97
-
98
-
99
-
100
 |
 |

25
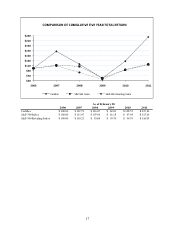
Fiscal 2010 Versus Fiscal 2009. The 8% increase in wholesale vehicle revenues in fiscal 2010 resulted from a 6%
increase in average wholesale vehicle selling price combined with a 2% increase in wholesale unit sales. The
increase in wholesale unit sales was mainly the result of a significant increase in our appraisal buy rate. We believe
the strong industry-wide wholesale vehicle pricing environment and the resulting increases in our appraisal offers
had a favorable effect on the appraisal buy rate. The benefit of the improvement in appraisal buy rate was largely
offset, however, by a double-digit decline in appraisal traffic, particularly in the first half of the year. Appraisal
traffic was adversely affected by both the slowdown in our customer traffic and by the reduction in new car industry
sales and the related used vehicle trade-in activity in fiscal 2010.
Other Sales and Revenues
Other sales and revenues include commissions on the sale of ESPs and GAP (reported in ESP revenues), service
department sales and net third-party finance fees. The fixed fees paid to us per vehicle financed by the majority of
our third-party financing providers vary by provider, reflecting their differing levels of credit risk exposure. The
third-party providers who purchase subprime financings generally purchase these loans at a discount, which is
reflected as an offset to finance fee revenues received on other third-party financings.
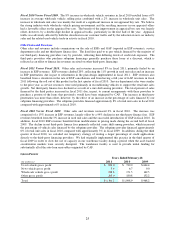
Fiscal 2011 Versus Fiscal 2010. Other sales and revenues increased 8% in fiscal 2011, primarily fueled by an
increase in ESP revenues. ESP revenues climbed 20%, reflecting the 11% growth in used unit sales and an increase
in ESP penetration, due in part to refinements in the plan design implemented in fiscal 2011. ESP revenues also
benefited from a slowdown in the rate of ESP cancellations and from having a full year of GAP revenues in fiscal
2011 following the roll out of this product in the first quarter of fiscal 2010. Service department sales were similar
to the prior year, as service resources were used primarily in reconditioning vehicles to support the retail unit sales
growth. Net third-party finance fees declined as a result of a mix shift among providers. The total percent of sales
financed by the third parties increased in fiscal 2011 due, in part, to current arrangements with these providers to
purchase a portion of the loans that previously would have been originated by CAF. The increase in third-party
penetration was more than offset, however, by the effect of an increase in the percentage of sales financed by our
subprime financing providers. The subprime providers financed approximately 8% of retail unit sales in fiscal 2011
compared with approximately 6% in fiscal 2010.
Fiscal 2010 Versus Fiscal 2009. Other sales and revenues increased 2% in fiscal 2010. The increase was
comprised of a 15% increase in ESP revenues, largely offset by a 94% decline in net third-party finance fees. ESP
revenues benefited from the 3% increase in used unit sales and the successful introduction of GAP in fiscal 2010. In
addition, fiscal 2010 ESP revenues benefited from modifications in pricing made during the second half of fiscal
2009. The decline in net third-party finance fees primarily reflected a mix shift among providers, which increased
the percentage of vehicle sales financed by the subprime provider. The subprime provider financed approximately
6% of retail unit sales in fiscal 2010 compared with approximately 3% in fiscal 2009. In addition, during the third
quarter of fiscal 2010, we curtailed our temporary strategy of routing a larger percentage of credit applications
directly to the third-party financing providers. We had originally implemented this practice in the third quarter of
fiscal 2009 in order to slow the use of capacity in our warehouse facility during a period when the asset-backed
securitization markets were severely disrupted. The warehouse facility is used to provide initial funding for
substantially all of the auto loan receivables originated by CAF.
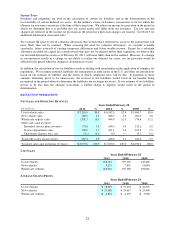
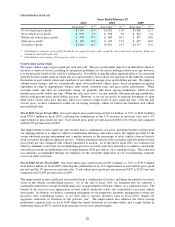
GROSS PROFIT
(In millions)
Used vehicle gross profit 854.0$ 739.9$ 644.4$
New vehicle gross profit 5.4 6.7 9.0
Wholesale vehicle gross profit 238.8 171.5 162.5
Other gross profit 203.0 180.8 152.2
Total 1,301.2$ 1,098.9$ 968.2$
Years Ended February 28
2011
2010
2009