CarMax 2011 Annual Report Download - page 53
Download and view the complete annual report
Please find page 53 of the 2011 CarMax annual report below. You can navigate through the pages in the report by either clicking on the pages listed below, or by using the keyword search tool below to find specific information within the annual report.-
 1
1 -
2
-
3
-
4
-
5
-
6
-
7
-
8
-
9
-
10
-
11
-
12
-
13
-
14
-
15
-
16
-
17
-
18
-
19
-
20
-
21
-
22
-
23
-
24
-
25
-
26
-
27
-
28
-
29
-
30
-
31
-
32
-
33
-
34
-
35
-
36
-
37
-
38
-
39
-
40
-
41
-
42
-
 43
43 -
 44
44 -
 45
45 -
 46
46 -
 47
47 -
 48
48 -
 49
49 -
 50
50 -
 51
51 -
 52
52 -
 53
53 -
 54
54 -
 55
55 -
 56
56 -
 57
57 -
 58
58 -
 59
59 -
 60
60 -
 61
61 -
 62
62 -
 63
63 -
64
-
65
-
66
-
67
-
68
-
69
-
70
-
71
-
72
-
73
-
74
-
75
-
76
-
77
-
78
-
79
-
80
-
81
-
82
-
83
-
84
-
85
-
86
-
87
-
88
-
89
-
90
-
91
-
92
-
93
-
94
-
95
-
96
-
97
-
98
-
99
-
100
 |
 |
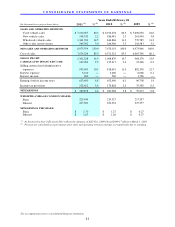
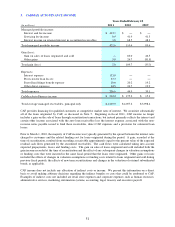
C O N S O L I D A T E D S T A T E M E N T S O F C A S H F L O W S
See accompanying notes to consolidated financial statements.
43
(In thousands)
OPERATING ACTIVITIES:
Net earnings 380,878$ 281,668$ 59,213$
Adjustments to reconcile net earnings to net cash
(used in) provided by operating activities:
Depreciation and amortization 59,421 58,328 54,741
Share-based compensation expense 43,606 37,858 35,436
Provision for loan losses 27,749 ― ―
Loss on disposition of assets 1,143 372 10,728
Deferred income tax provision (benefit) 19,393 29,761 (41,502)
Impairment of long-lived assets ― 2,055 ―
Net (increase) decrease in:
Accounts receivable, net (40,538) (23,558) (2,648)
Auto loan receivables held for sale, net ― (20,830) (4,764)
Retained interest in securitized receivables 43,746 (204,115) (77,501)
Inventory (206,344) (139,976) 272,620
Other current assets (27,403) 3,095 9,090
Auto loan receivables, net (304,729) ― ―
Other assets (6,790) 917 647
Net (decrease) increase in:
Accounts payable, accrued expenses and other current
liabilities and accrued income taxes (8,715) 33,818 (40,276)
Other liabilities 1,385 (9,103) (11,193)
NET CASH (USED IN) PROVIDED BY OPERATING ACTIVITIES (17,198) 50,290 264,591
INVESTING ACTIVITIES:
Capital expenditures (76,580) (22,434) (185,700)
Proceeds from sales of assets 8 662 34,341
Insurance proceeds related to damaged property ― 447 ―
Decrease in restricted cash from collections on auto loan receivables 1,556 ― ―
Increase in restricted cash in reserve accounts (12,631) ― ―
Release of restricted cash from reserve accounts 11,434 ― ―
Sales (purchases) of money market securities, net 4,001 (2,196) (3,987)
Sales of investments available-for-sale ― 2,200 ―
NET CASH USED IN INVESTING ACTIVITIES (72,212) (21,321) (155,346)
FINANCING ACTIVITIES:
Increase (decrease) in short-term debt, net 119 5 (20,139)
Issuances of long-term debt 243,300 606,500 789,800
Payments on long-term debt (365,605) (792,981) (761,827)
Issuances of non-recourse notes payable 3,348,000 ― ―
Payments on non-recourse notes payable (3,160,749) ― ―
Equity issuances, net 38,277 31,307 10,162
Excess tax benefits from share-based payment arrangements 8,911 3,881 391
NET CASH PROVIDED BY (USED IN) FINANCING ACTIVITIES 112,253 (151,288) 18,387
Increase (decrease) increase in cash and cash equivalents 22,843 (122,319) 127,632
Cash and cash equivalents at beginning of year 18,278 140,597 12,965
CASH AND CASH EQUIVALENTS AT END OF YEAR 41,121$ 18,278$ 140,597$
SUPPLEMENTAL DISCLOSURES OF CASH FLOW INFORMATION
Cash paid for interest 521$ 4,796$ 10,171$
Cash paid for income taxes 242,510$ 163,324$ 64,023$
Non-cash investing and financing activities:
Increase (decrease) in accrued capital expenditures 6,395$ (5,823)$ (12,861)$
Increase in capital lease obligations 1,739$ ―$ 1,382$
Years Ended February 28
2011
2010
2009