CarMax 2011 Annual Report Download - page 39
Download and view the complete annual report
Please find page 39 of the 2011 CarMax annual report below. You can navigate through the pages in the report by either clicking on the pages listed below, or by using the keyword search tool below to find specific information within the annual report.-
 1
1 -
2
-
3
-
4
-
5
-
6
-
7
-
8
-
9
-
10
-
11
-
12
-
13
-
14
-
15
-
16
-
17
-
18
-
19
-
20
-
21
-
22
-
23
-
24
-
25
-
26
-
27
-
28
-
 29
29 -
 30
30 -
 31
31 -
 32
32 -
 33
33 -
 34
34 -
 35
35 -
 36
36 -
 37
37 -
 38
38 -
 39
39 -
 40
40 -
 41
41 -
 42
42 -
 43
43 -
 44
44 -
 45
45 -
 46
46 -
 47
47 -
 48
48 -
 49
49 -
50
-
51
-
52
-
53
-
54
-
55
-
56
-
57
-
58
-
59
-
60
-
61
-
62
-
63
-
64
-
65
-
66
-
67
-
68
-
69
-
70
-
71
-
72
-
73
-
74
-
75
-
76
-
77
-
78
-
79
-
80
-
81
-
82
-
83
-
84
-
85
-
86
-
87
-
88
-
89
-
90
-
91
-
92
-
93
-
94
-
95
-
96
-
97
-
98
-
99
-
100
 |
 |

29
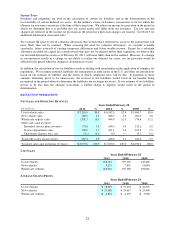
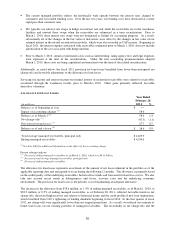
COMPONENTS OF CAF INCOME
(In millions)
Managed portfolio income:
Interest and fee income
$ 419.1 $ ― $ ―
Servicing fee income
0.9 41.9 41.3
Interest income on retained interest in securitized receivables
1.6 68.5 48.3
Total managed portfolio income
421.6 110.4 89.6
Gain (loss):
Gain on sales of loans originated and sold
― 83.0 46.5
Other gains
5.0 26.7 (81.8)
Total gain (loss)
5.0 109.7 (35.3)
Expenses:
Interest expense
133.8 ― ―
Provision for loan losses
27.7 ― ―
Payroll and fringe benefit expense
20.6 20.2 19.2
Other direct expenses
24.5 24.7 19.9
Total expenses
206.6 44.9 39.1
CarMax Auto Finance income
$ 220.0 $ 175.2 $ 15.3
Total average managed receivables, principal only
$ 4,229.9 $ 4,057.2 $ 3,998.4
Years Ended February 28
2011
2010
2009
CAF income does not include any allocation of indirect costs or income. We present this information on a direct
basis to avoid making arbitrary decisions regarding the indirect benefits or costs that could be attributed to CAF.
Examples of indirect costs not included are retail store expenses and corporate expenses such as human resources,
administrative services, marketing, information systems, accounting, legal, treasury and executive payroll.
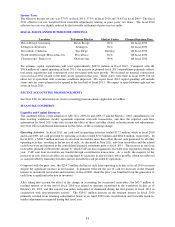
Fiscal 2011. CAF reported income of $220.0 million in fiscal 2011, largely driven by the spread between interest
and fee income charged to consumers and our funding costs. CAF income also reflected favorability in our
provision for loan losses resulting from better-than-expected loss experience.
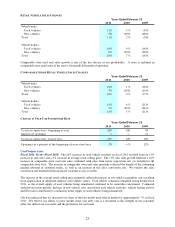
NET INTEREST INCOME
(In millions) 2011
% (1)
Interest and fee income 419.1$
9.9
Interest expense (133.8)
(3.2)
Net interest income 285.3
6.7
Provision for loan losses (27.7)
(0.7)
Net interest income after provision for loan losses 257.6$
6.1
Total average managed receivables, principal only 4,229.9$
Year Ended
February 28
(1) Percent of total average managed receivables, principal only.
Net interest income before the provision for loan losses, which reflects the spread between the interest charged to
consumers and our funding costs, was 6.7% of total average managed receivables, principal only, in fiscal 2011.
This spread was favorably affected by the following factors: