CarMax 2011 Annual Report Download - page 71
Download and view the complete annual report
Please find page 71 of the 2011 CarMax annual report below. You can navigate through the pages in the report by either clicking on the pages listed below, or by using the keyword search tool below to find specific information within the annual report.-
 1
1 -
2
-
3
-
4
-
5
-
6
-
7
-
8
-
9
-
10
-
11
-
12
-
13
-
14
-
15
-
16
-
17
-
18
-
19
-
20
-
21
-
22
-
23
-
24
-
25
-
26
-
27
-
28
-
29
-
30
-
31
-
32
-
33
-
34
-
35
-
36
-
37
-
38
-
39
-
40
-
41
-
42
-
43
-
44
-
45
-
46
-
47
-
48
-
49
-
50
-
51
-
52
-
53
-
54
-
55
-
56
-
57
-
58
-
59
-
60
-
 61
61 -
 62
62 -
 63
63 -
 64
64 -
 65
65 -
 66
66 -
 67
67 -
 68
68 -
 69
69 -
 70
70 -
 71
71 -
 72
72 -
 73
73 -
 74
74 -
 75
75 -
 76
76 -
 77
77 -
 78
78 -
 79
79 -
 80
80 -
 81
81 -
82
-
83
-
84
-
85
-
86
-
87
-
88
-
89
-
90
-
91
-
92
-
93
-
94
-
95
-
96
-
97
-
98
-
99
-
100
 |
 |

61
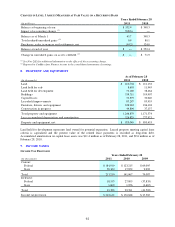
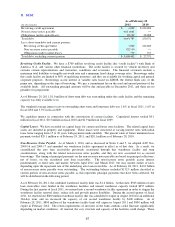
CHANGES IN LEVEL 3 ASSETS MEASURED AT FAIR VALUE ON A RECURRING BASIS
(In millions)
Balance at beginning of year $ 552.4 $ 348.3
Impact of accounting change (1) (508.6) ―
Balance as of March 1 43.7 348.3
Total realized/unrealized gains (2) 0.4 80.1
Purchases, sales, issuances and settlements, net (44.2) 124.0
Balance at end of year $ ― $ 552.4
Change in unrealized gains on assets still held (2) $ ― $ 71.9
2011
2010
Years Ended February 28
(1) See Note 2(E) for additional information on the effects of the accounting change.
(2) Reported in CarMax Auto Finance income in the consolidated statements of earnings.
8. PROPERTY AND EQUIPMENT
(In thousands)
Land 216,794$ 211,132$
Land held for sale 8,693 11,945
Land held for development 72,168 38,464
Buildings 539,711 519,907
Capital leases 32,379 30,640
Leasehold improvements 83,287 85,955
Furniture, fixtures and equipment 248,944 236,194
Construction in progress 44,894 37,137
Total property and equipment 1,246,870 1,171,374
Less accumulated depreciation and amortization 326,825 277,921
Property and equipment, net 920,045$ 893,453$
As of February 28
2011
2010
Land held for development represents land owned for potential expansion. Leased property meeting capital lease
criteria is capitalized and the present value of the related lease payments is recorded as long-term debt.
Accumulated amortization on capital lease assets was $11.4 million as of February 28, 2011, and $9.6 million as of
February 28, 2010.
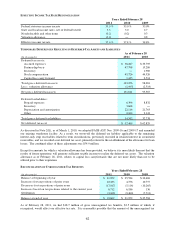
9. INCOME TAXES
INCOME TAX PROVISION
(In thousands)
Current:
Federal 184,919$ 123,215$ 69,095$
State 28,300 17,852 9,992
Total 213,219 141,067 79,087
Deferred:
Federal 18,333 27,805 (37,835)
State 1,060 1,956 (3,667)
Total 19,393 29,761 (41,502)
Income tax provision 232,612$ 170,828$ 37,585$
Years Ended February 28
2011
2010
2009