CarMax 2011 Annual Report Download - page 28
Download and view the complete annual report
Please find page 28 of the 2011 CarMax annual report below. You can navigate through the pages in the report by either clicking on the pages listed below, or by using the keyword search tool below to find specific information within the annual report.-
 1
1 -
2
-
3
-
4
-
5
-
6
-
7
-
8
-
9
-
10
-
11
-
12
-
13
-
14
-
15
-
16
-
17
-
 18
18 -
 19
19 -
 20
20 -
 21
21 -
 22
22 -
 23
23 -
 24
24 -
 25
25 -
 26
26 -
 27
27 -
 28
28 -
 29
29 -
 30
30 -
 31
31 -
 32
32 -
 33
33 -
 34
34 -
 35
35 -
 36
36 -
 37
37 -
 38
38 -
39
-
40
-
41
-
42
-
43
-
44
-
45
-
46
-
47
-
48
-
49
-
50
-
51
-
52
-
53
-
54
-
55
-
56
-
57
-
58
-
59
-
60
-
61
-
62
-
63
-
64
-
65
-
66
-
67
-
68
-
69
-
70
-
71
-
72
-
73
-
74
-
75
-
76
-
77
-
78
-
79
-
80
-
81
-
82
-
83
-
84
-
85
-
86
-
87
-
88
-
89
-
90
-
91
-
92
-
93
-
94
-
95
-
96
-
97
-
98
-
99
-
100
 |
 |

18
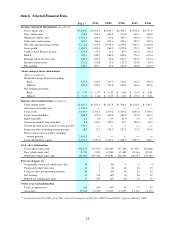
Item 6. Selected Financial Data.
FY11 (1) FY10 FY09 FY08 FY07 FY06
Income statement information (In millions)
Used vehicle sales $7,210.0 $6,192.3 $5,690.7 $6,589.3 $5,872.8 $4,771.3
New vehicle sales 198.5 186.5 261.9 370.6 445.1 502.8
Wholesale vehicle sales 1,301.7 844.9 779.8 985.0 918.4 778.3
Other sales and revenues 265.3 246.6 241.6 254.6 229.3 207.6
Net sales and operating revenues 8,975.6 7,470.2 6,974.0 8,199.6 7,465.7 6,260.0
Gross profit 1,301.2 1,098.9 968.2 1,072.4 971.1 790.7
CarMax Auto Finance income 220.0 175.2 15.3 85.9 132.6 104.3
SG&A 905.1 818.7 882.4 858.4 776.2 674.4
Earnings before income taxes 613.5 452.5 96.8 297.1 323.3 217.6
Income tax provision 232.6 170.8 37.6 115.0 124.8 83.4
Net earnings 380.9 281.7 59.2 182.0 198.6 134.2
Share and per share information
(Shares in millions)
Weighted average shares outstanding:
Basic 223.4 219.5 217.5 216.0 212.5 209.3
Diluted 227.6 222.2 219.4 220.0 216.6 212.8
Net earnings per share:
Basic $ 1.70 $ 1.27 $ 0.27 $ 0.84 $ 0.93 $ 0.64
Diluted $ 1.67 $ 1.26 $ 0.27 $ 0.82 $ 0.91 $ 0.63
Balance sheet information (In millions)
Total current assets $1,410.1 $1,556.4 $1,287.8 $1,356.9 $1,150.5 $ 941.7
Auto loan receivables, net 4,320.6 ― ― ― ― ―
Total assets 6,839.9 2,556.2 2,379.2 2,333.2 1,885.6 1,509.6
Total current liabilities 508.2 477.4 490.8 490.0 512.0 344.9
Short-term debt 1.0 0.9 0.9 21.0 3.3 0.5
Current portion of long-term debt 0.8 122.3 158.1 79.7 148.4 59.8
Current portion of non-recourse notes payable 132.5 ― ― ― ― ―
Long-term debt, excluding current portion 28.4 27.4 178.1 227.2 33.7 134.8
Non-recourse notes payable, excluding
current portion 3,881.1 ― ― ― ― ―
Total shareholders’ equity 2,291.6 1,933.6 1,593.1 1,488.9 1,247.4 980.1
Unit sales information
Used vehicle units sold 396,181 357,129 345,465 377,244 337,021 289,888
New vehicle units sold 8,231 7,851 11,084 15,485 18,563 20,901
Wholesale vehicle units sold 263,061 197,382 194,081 222,406 208,959 179,548
Percent changes in
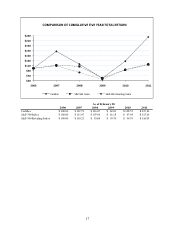
Comparable store used vehicle unit sales 10 1 (16) 3 9 4
Total used vehicle unit sales 11 3 (8) 12 16 15
Total net sales and operating revenues 20 7 (15) 10 19 19
Net earnings 35 376 (67) (8) 48 32
Diluted net earnings per share 33 367 (67) (10) 46 31
Other year-end information
Used car superstores 103 100 100 89 77 67
Associates 15,565 13,439 13,035 15,637 13,736 11,712
(1) As discussed in Note 2(E), fiscal 2011 reflects the adoption of ASU Nos. 2009-16 and 2009-17 effective March 1, 2010.