CarMax 2011 Annual Report Download - page 27
Download and view the complete annual report
Please find page 27 of the 2011 CarMax annual report below. You can navigate through the pages in the report by either clicking on the pages listed below, or by using the keyword search tool below to find specific information within the annual report.-
 1
1 -
2
-
3
-
4
-
5
-
6
-
7
-
8
-
9
-
10
-
11
-
12
-
13
-
14
-
15
-
16
-
 17
17 -
 18
18 -
 19
19 -
 20
20 -
 21
21 -
 22
22 -
 23
23 -
 24
24 -
 25
25 -
 26
26 -
 27
27 -
 28
28 -
 29
29 -
 30
30 -
 31
31 -
 32
32 -
 33
33 -
 34
34 -
 35
35 -
 36
36 -
 37
37 -
38
-
39
-
40
-
41
-
42
-
43
-
44
-
45
-
46
-
47
-
48
-
49
-
50
-
51
-
52
-
53
-
54
-
55
-
56
-
57
-
58
-
59
-
60
-
61
-
62
-
63
-
64
-
65
-
66
-
67
-
68
-
69
-
70
-
71
-
72
-
73
-
74
-
75
-
76
-
77
-
78
-
79
-
80
-
81
-
82
-
83
-
84
-
85
-
86
-
87
-
88
-
89
-
90
-
91
-
92
-
93
-
94
-
95
-
96
-
97
-
98
-
99
-
100
 |
 |

17
$50
$70
$90
$110
$130
$150
$170
$190
$210
$230
2006
2007
2008
2009
2010
2011
CarMax
S&P 500 Index
S&P 500 Retailing Index
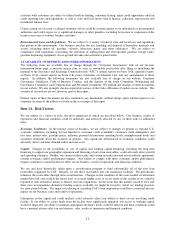
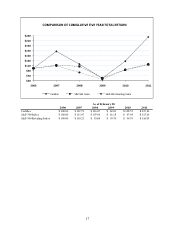
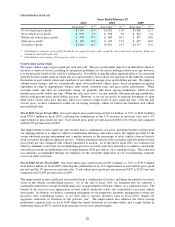
COMPARISON OF CUMULATIVE FIVE YEAR TOTAL RETURN
CarMax 100.00$ 167.73$ 116.87$ 60.03$ 128.52$ 225.14$
S&P 500 Index 100.00$ 111.97$ 107.94$ 61.18$ 93.98$ 115.20$
S&P 500 Retailing Index 100.00$ 110.21$ 83.68$ 55.70$ 94.79$ 116.85$
2011
As of February 28
2006
2007
2008
2009
2010