CarMax 2011 Annual Report Download - page 37
Download and view the complete annual report
Please find page 37 of the 2011 CarMax annual report below. You can navigate through the pages in the report by either clicking on the pages listed below, or by using the keyword search tool below to find specific information within the annual report.-
 1
1 -
2
-
3
-
4
-
5
-
6
-
7
-
8
-
9
-
10
-
11
-
12
-
13
-
14
-
15
-
16
-
17
-
18
-
19
-
20
-
21
-
22
-
23
-
24
-
25
-
26
-
 27
27 -
 28
28 -
 29
29 -
 30
30 -
 31
31 -
 32
32 -
 33
33 -
 34
34 -
 35
35 -
 36
36 -
 37
37 -
 38
38 -
 39
39 -
 40
40 -
 41
41 -
 42
42 -
 43
43 -
 44
44 -
 45
45 -
 46
46 -
 47
47 -
48
-
49
-
50
-
51
-
52
-
53
-
54
-
55
-
56
-
57
-
58
-
59
-
60
-
61
-
62
-
63
-
64
-
65
-
66
-
67
-
68
-
69
-
70
-
71
-
72
-
73
-
74
-
75
-
76
-
77
-
78
-
79
-
80
-
81
-
82
-
83
-
84
-
85
-
86
-
87
-
88
-
89
-
90
-
91
-
92
-
93
-
94
-
95
-
96
-
97
-
98
-
99
-
100
 |
 |
27
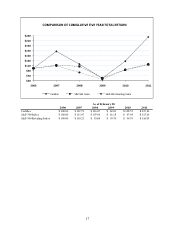
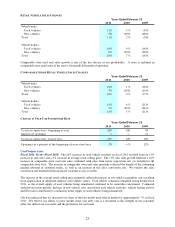
New Vehicle Gross Profit
Fiscal 2011 Versus Fiscal 2010. Our new vehicle gross profit declined 20% to $5.4 million from $6.7 million in
fiscal 2010. The reduction occurred as the benefit of the 5% increase in new vehicle unit sales was more than offset
by a $199 reduction in gross profit per unit to $659 per unit from $858 per unit in fiscal 2010.
Fiscal 2010 Versus Fiscal 2009. Our new vehicle gross profit decreased 25% to $6.7 million from $9.0 million in
fiscal 2009. The reduction primarily reflected the 29% decline in new vehicle unit sales, partially offset by a 5%
increase in new vehicle gross profit per unit, which improved to $858 per unit from $814 per unit in fiscal 2009.
The industry-wide reductions in new vehicle inventories and incentives related to the cash for clunkers program
benefited the new vehicle gross profit dollars per unit in the second and third quarters of fiscal 2010.
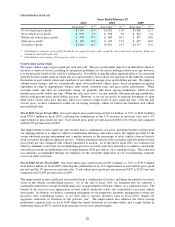
Wholesale Vehicle Gross Profit
Our wholesale vehicle gross profit has steadily increased over the last several years reflecting, in part, the benefits
realized from improvements and refinements in our car-buying strategies, appraisal delivery processes and in-store
auction processes. We have made continuous improvements in these processes, which we believe have allowed us
to become more efficient. Our in-store auctions have benefited from initiatives to increase our dealer-to-car ratio,
which we believe has allowed us to achieve higher prices. In addition, the frequency of our auctions, which are
generally held weekly or bi-weekly, minimizes the depreciation risk on these vehicles.
Fiscal 2011 Versus Fiscal 2010. Our wholesale vehicle gross profit increased $67.3 million, or 39%, to
$238.8 million from $171.5 million in fiscal 2010. The improvement reflected the 33% increase in wholesale unit
sales combined with a 4% rise in wholesale vehicle gross profit per unit. Wholesale vehicle gross profit per unit
increased $39 to $908 per unit from $869 per unit in fiscal 2010. The strength of our wholesale gross profit per unit
reflected the strong demand for older, higher mileage vehicles, which are the mainstay of our auctions, as well as the
continued strong dealer attendance and resulting high dealer-to-car ratios at our auctions.
Fiscal 2010 Versus Fiscal 2009. Our wholesale vehicle gross profit increased $8.9 million, or 5%, to
$171.5 million from $162.5 million in fiscal 2009, reflecting the combination of a 4% improvement in wholesale
vehicle gross profit per unit and the 2% increase in wholesale unit sales. Wholesale gross profit per unit increased
$32 to $869 per unit compared with $837 per unit in fiscal 2009. The improvement in the wholesale vehicle gross
profit per unit primarily reflected the higher year-over-year wholesale pricing environment. We also achieved a new
record dealer-to-car ratio at our auctions in fiscal 2010, with the resulting price competition among bidders
contributing to the strong wholesale gross profit per unit.
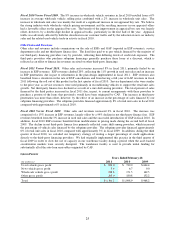
Other Gross Profit
Other gross profit includes profits related to ESP and GAP revenues, net third-party finance fees and service
department sales. We have no cost of sales related to ESP and GAP revenues or net third-party finance fees, as
these represent commissions paid to us by certain third-party providers, net of the discount associated with the loans
purchased by subprime providers. Accordingly, changes in the relative mix of the other gross profit components can
affect the composition of other gross profit.
Fiscal 2011 Versus Fiscal 2010. Other gross profit increased $22.1 million, or 12%, to $203.0 million from
$180.8 million in fiscal 2010. Other gross profit per unit improved modestly to $502 per unit from $495 per unit in
fiscal 2010. ESP and GAP gross profit increased $29.3 million, or 20%, benefiting from the 11% increase in used
unit sales, the improved ESP penetration rate and the prior year roll out of the GAP product. Service department
gross profit grew $2.9 million, or 8%. The increases in ESP and GAP and service department gross profits were
partially offset by a $10.1 million reduction in net third-party finance fees, which were adversely affected by the mix
shift among providers.
Fiscal 2010 Versus Fiscal 2009. Other gross profit increased $28.6 million, or 19%, to $180.8 million from
$152.2 million in fiscal 2009. Other gross profit per unit increased $68, or 16%, to $495 per unit from $427 per unit
in fiscal 2009. ESP gross profit increased $19.3 million, or 15%, benefiting from the introduction of GAP, the
modifications in pricing made during the second half of fiscal 2009 and the 3% increase in used unit sales. Service
department gross profit grew $23.6 million, primarily because our retail vehicle sale growth outpaced fixed service
overhead costs. The increases in ESP and service department gross profit were partially offset by a $14.3 million
reduction in net third-party finance fees, which were adversely affected by the mix shift among providers and the
termination of our temporary practice of reducing CAF originations by routing more credit applications to our third-
party providers.